| Param | Original file | Final file |
|---|---|---|
| Filename | modeM0/AS1T03_066T01_9000002600cztM0_level2_bc.evt | modeM0/AS1T03_066T01_9000002600cztM0_level2_quad_clean.evt |
| Size (bytes) | 4,488,451,200 | 1,463,071,680 |
| Size | 4.2 GB | 1.4 GB |
| Events in quadrant A | 37,445,661 | 9,234,929 |
| Events in quadrant B | 28,996,632 | 9,317,061 |
| Events in quadrant C | 29,956,561 | 9,055,543 |
| Events in quadrant D | 31,726,772 | 8,852,822 |
| Mode SS | |||
|---|---|---|---|
| Quadrant | BADHDUFLAG | Total packets | Discarded packets |
| A | 0 | 2332 | 0 |
| B | 0 | 2332 | 0 |
| C | 0 | 2332 | 0 |
| D | 0 | 2332 | 0 |
| Mode M0 | |||
|---|---|---|---|
| Quadrant | BADHDUFLAG | Total packets | Discarded packets |
| A | 0 | 295746 | 0 |
| B | 0 | 259618 | 0 |
| C | 0 | 256318 | 0 |
| D | 0 | 270954 | 0 |
| Mode M9 | |||
|---|---|---|---|
| Quadrant | BADHDUFLAG | Total packets | Discarded packets |
| A | 0 | 199 | 0 |
| B | 0 | 199 | 0 |
| C | 0 | 199 | 0 |
| D | 0 | 199 | 0 |
| Quadrant | Total seconds | Saturated seconds | Saturation percentage |
|---|---|---|---|
| A | 114627 | 6898 | 6.017779% |
| B | 114627 | 3817 | 3.329931% |
| C | 114627 | 2939 | 2.563968% |
| D | 114627 | 4343 | 3.788811% |
Noise dominated data is calculated using 1-second bins in cleaned event files. If a bin has >2000 counts, and if more than 50% of those come from <1% of pixels, then it is considered to be noise-dominated and hence unusable.
| Quadrant | # 1 sec bins | Bins with >0 counts | Bins with >2000 counts | High rate bins dominated by noise | Noise dominated (total time) | Noise dominated (detector-on time) | Marked lightcurve |
|---|---|---|---|---|---|---|---|
| A | 134393 | 114623 | 123 | 123 | 0.09% | 0.11% | 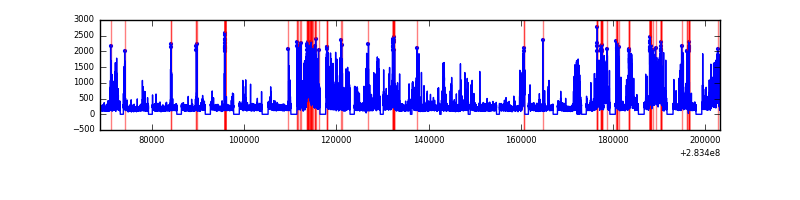 |
| B | 134393 | 114616 | 199 | 199 | 0.15% | 0.17% |  |
| C | 134393 | 114625 | 573 | 573 | 0.43% | 0.50% |  |
| D | 134393 | 114471 | 330 | 330 | 0.25% | 0.29% |  |
Top three noisy pixels from each quadrant. If the there are fewer than three noisy pixels in the level2.evt file, extra rows are filled as -1
| Pixel properties | Quadrant properties | ||||||
|---|---|---|---|---|---|---|---|
| Quadrant | DetID | PixID | Counts | Sigma | Mean | Median | Sigma |
| A | 14 | 237 | 14057726 | 10998.51 | 5892 | 5789 | 1277.6 |
| A | 15 | 174 | 758293 | 588.99 | 5892 | 5789 | 1277.6 |
| A | 0 | 226 | 38682 | 25.75 | 5892 | 5789 | 1277.6 |
| B | 10 | 245 | 4857633 | 4312.02 | 6003 | 5854 | 1125.2 |
| B | 6 | 36 | 372068 | 325.47 | 6003 | 5854 | 1125.2 |
| B | 15 | 222 | 126668 | 107.37 | 6003 | 5854 | 1125.2 |
| C | 0 | 79 | 4453345 | 3313.5 | 5769 | 5733 | 1342.3 |
| C | 3 | 233 | 2800238 | 2081.93 | 5769 | 5733 | 1342.3 |
| C | 5 | 218 | 256334 | 186.7 | 5769 | 5733 | 1342.3 |
| D | 7 | 238 | 3110914 | 2329.76 | 5803 | 5607 | 1332.9 |
| D | 5 | 222 | 2885078 | 2160.33 | 5803 | 5607 | 1332.9 |
| D | 13 | 189 | 1911126 | 1429.62 | 5803 | 5607 | 1332.9 |
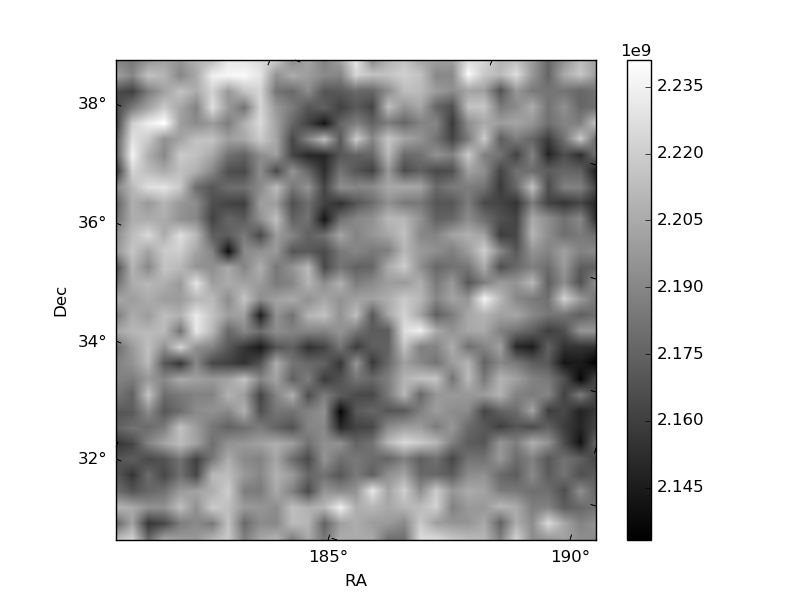
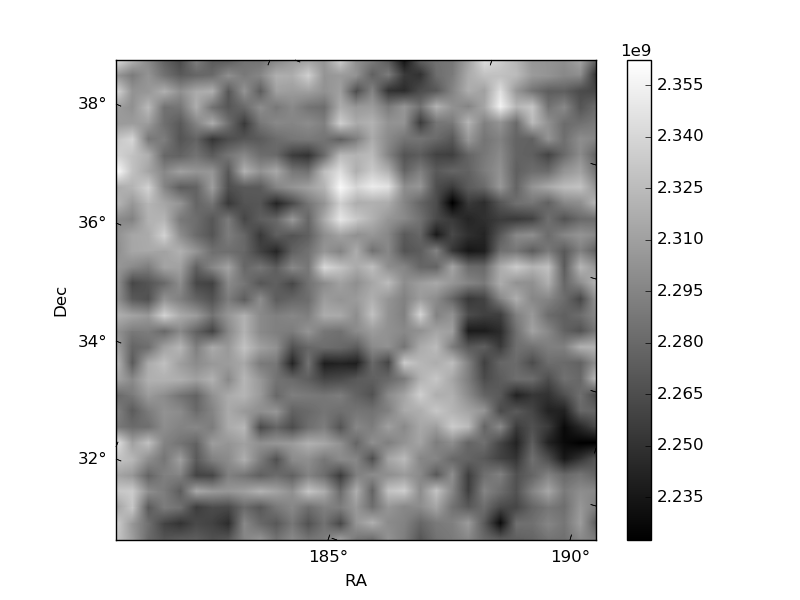
Histogram calculated using DETX and DETY for each event in the final _common_clean file
| Quadrant A |  |
 |
Quadrant B |
|---|---|---|---|
| Quadrant D |  |
 |
Quadrant C |
| Plot type | Count rate plots | Images |
|---|---|---|
| Comparison with Poisson distribution Blue bars denote a histogram of data divided into 1 sec bins. Red curve is a Poisson curve with rate = median count rate of data. |
 |
 |
| Quadrant-wise count rates Data is divided into 100 sec bins |
 |
|
| Module-wise count rates for Quadrant A Data is divided into 100 sec bins |
 |
 |
| Module-wise count rates for Quadrant B Data is divided into 100 sec bins |
 |
 |
| Module-wise count rates for Quadrant C Data is divided into 100 sec bins |
 |
 |
| Module-wise count rates for Quadrant D Data is divided into 100 sec bins |
 |
 |
| Parameter | Plot |
|---|---|
| CZT HV Monitor | 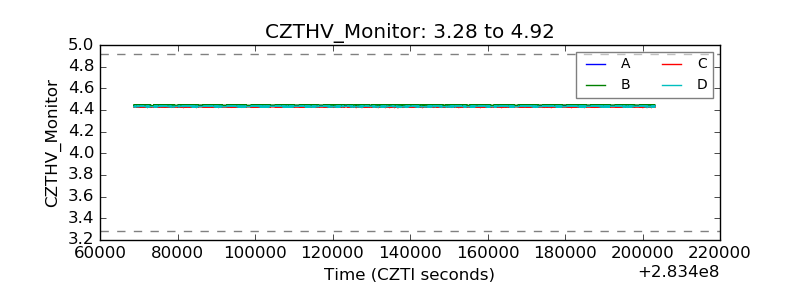 |
| D_VDD |  |
| Temperature 1 |  |
| Veto HV Monitor |  |
| Veto LLD |  |
| Alpha Counter |  |
| _CPM_Rate |  |
| CZT Counter |  |
| +2.5 Volts monitor |  |
| +5 Volts monitor |  |
| _ROLL_ROT |  |
| _Roll_DEC |  |
| _Roll_RA |  |
| Veto Counter | 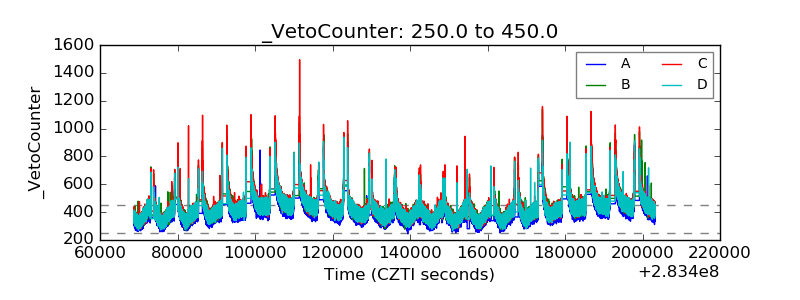 |