| Param | Original file | Final file |
|---|---|---|
| Filename | modeM0/AS1A05_140T01_9000002596cztM0_level2_bc.evt | modeM0/AS1A05_140T01_9000002596cztM0_level2_quad_clean.evt |
| Size (bytes) | 2,675,508,480 | 1,029,432,960 |
| Size | 2.5 GB | 981.7 MB |
| Events in quadrant A | 17,815,347 | 6,538,700 |
| Events in quadrant B | 17,170,522 | 6,593,597 |
| Events in quadrant C | 18,139,833 | 6,308,623 |
| Events in quadrant D | 22,404,103 | 6,211,159 |
| Mode M0 | |||
|---|---|---|---|
| Quadrant | BADHDUFLAG | Total packets | Discarded packets |
| A | 0 | 171920 | 0 |
| B | 0 | 168295 | 0 |
| C | 0 | 173088 | 0 |
| D | 0 | 185641 | 0 |
| Mode M9 | |||
|---|---|---|---|
| Quadrant | BADHDUFLAG | Total packets | Discarded packets |
| A | 0 | 132 | 0 |
| B | 0 | 132 | 0 |
| C | 0 | 132 | 0 |
| D | 0 | 132 | 0 |
| Mode SS | |||
|---|---|---|---|
| Quadrant | BADHDUFLAG | Total packets | Discarded packets |
| A | 0 | 1642 | 0 |
| B | 0 | 1642 | 0 |
| C | 0 | 1642 | 0 |
| D | 0 | 1642 | 0 |
| Quadrant | Total seconds | Saturated seconds | Saturation percentage |
|---|---|---|---|
| A | 80645 | 1376 | 1.706243% |
| B | 80645 | 1101 | 1.365243% |
| C | 80645 | 1356 | 1.681443% |
| D | 80645 | 1923 | 2.384525% |
Noise dominated data is calculated using 1-second bins in cleaned event files. If a bin has >2000 counts, and if more than 50% of those come from <1% of pixels, then it is considered to be noise-dominated and hence unusable.
| Quadrant | # 1 sec bins | Bins with >0 counts | Bins with >2000 counts | High rate bins dominated by noise | Noise dominated (total time) | Noise dominated (detector-on time) | Marked lightcurve |
|---|---|---|---|---|---|---|---|
| A | 93850 | 80641 | 33 | 33 | 0.04% | 0.04% |  |
| B | 93850 | 80642 | 6 | 6 | 0.01% | 0.01% |  |
| C | 93850 | 80641 | 0 | 0 | 0.00% | 0.00% |  |
| D | 93850 | 80642 | 238 | 238 | 0.25% | 0.30% |  |
Top three noisy pixels from each quadrant. If the there are fewer than three noisy pixels in the level2.evt file, extra rows are filled as -1
| Pixel properties | Quadrant properties | ||||||
|---|---|---|---|---|---|---|---|
| Quadrant | DetID | PixID | Counts | Sigma | Mean | Median | Sigma |
| A | 15 | 174 | 1203387 | 1296.01 | 4296 | 4219 | 925.3 |
| A | 4 | 208 | 97872 | 101.22 | 4296 | 4219 | 925.3 |
| A | 0 | 226 | 28490 | 26.23 | 4296 | 4219 | 925.3 |
| B | 10 | 245 | 241809 | 293.86 | 4332 | 4231 | 808.5 |
| B | 0 | 189 | 91722 | 108.22 | 4332 | 4231 | 808.5 |
| B | 0 | 219 | 58327 | 66.91 | 4332 | 4231 | 808.5 |
| C | 3 | 233 | 1773295 | 1827.35 | 4160 | 4139 | 968.2 |
| C | 5 | 218 | 320934 | 327.21 | 4160 | 4139 | 968.2 |
| C | 13 | 61 | 24393 | 20.92 | 4160 | 4139 | 968.2 |
| D | 5 | 222 | 3840517 | 3953.37 | 4226 | 4090 | 970.4 |
| D | 13 | 189 | 1030320 | 1057.51 | 4226 | 4090 | 970.4 |
| D | 2 | 234 | 322422 | 328.04 | 4226 | 4090 | 970.4 |
Histogram calculated using DETX and DETY for each event in the final _common_clean file
| Quadrant A |  |
 |
Quadrant B |
|---|---|---|---|
| Quadrant D | 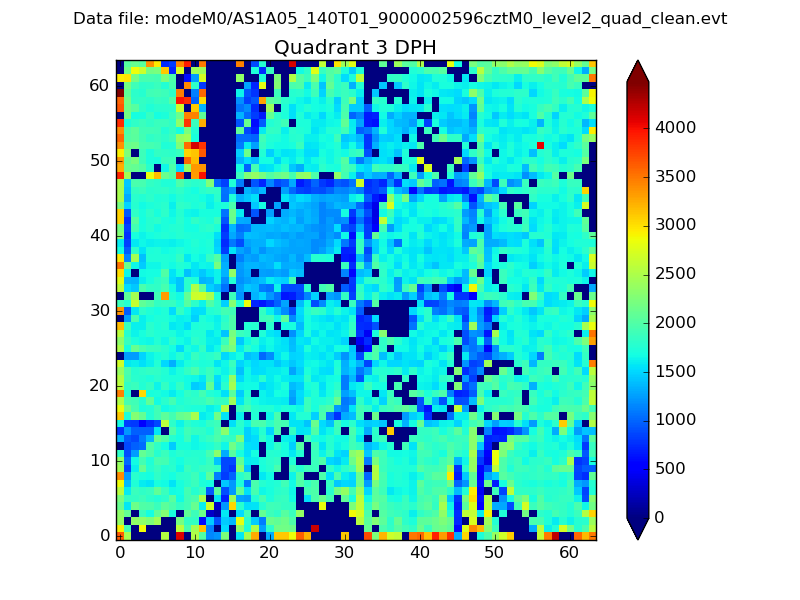 |
 |
Quadrant C |
| Plot type | Count rate plots | Images |
|---|---|---|
| Comparison with Poisson distribution Blue bars denote a histogram of data divided into 1 sec bins. Red curve is a Poisson curve with rate = median count rate of data. |
 |
 |
| Quadrant-wise count rates Data is divided into 100 sec bins |
 |
|
| Module-wise count rates for Quadrant A Data is divided into 100 sec bins |
 |
 |
| Module-wise count rates for Quadrant B Data is divided into 100 sec bins |
 |
 |
| Module-wise count rates for Quadrant C Data is divided into 100 sec bins |
 |
 |
| Module-wise count rates for Quadrant D Data is divided into 100 sec bins |
 |
 |
| Parameter | Plot |
|---|---|
| CZT HV Monitor |  |
| D_VDD |  |
| Temperature 1 |  |
| Veto HV Monitor |  |
| Veto LLD |  |
| Alpha Counter |  |
| _CPM_Rate | 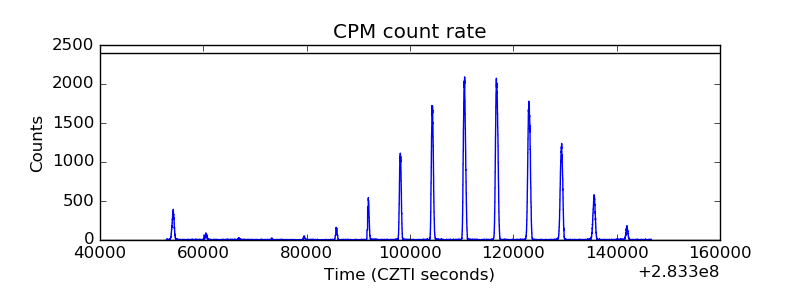 |
| CZT Counter |  |
| +2.5 Volts monitor |  |
| +5 Volts monitor |  |
| _ROLL_ROT |  |
| _Roll_DEC |  |
| _Roll_RA |  |
| Veto Counter |  |