| Param | Original file | Final file |
|---|---|---|
| Filename | modeM0/AS1T03_068T01_9000002594cztM0_level2_bc.evt | modeM0/AS1T03_068T01_9000002594cztM0_level2_quad_clean.evt |
| Size (bytes) | 2,457,869,760 | 1,150,891,200 |
| Size | 2.3 GB | 1.1 GB |
| Events in quadrant A | 16,850,277 | 7,573,197 |
| Events in quadrant B | 16,714,826 | 7,606,045 |
| Events in quadrant C | 16,143,286 | 7,207,940 |
| Events in quadrant D | 19,394,590 | 7,112,885 |
| Mode M9 | |||
|---|---|---|---|
| Quadrant | BADHDUFLAG | Total packets | Discarded packets |
| A | 0 | 135 | 0 |
| B | 0 | 135 | 0 |
| C | 0 | 135 | 0 |
| D | 0 | 135 | 0 |
| Mode M0 | |||
|---|---|---|---|
| Quadrant | BADHDUFLAG | Total packets | Discarded packets |
| A | 0 | 163939 | 0 |
| B | 0 | 162688 | 0 |
| C | 0 | 161474 | 0 |
| D | 0 | 173943 | 0 |
| Mode SS | |||
|---|---|---|---|
| Quadrant | BADHDUFLAG | Total packets | Discarded packets |
| A | 0 | 1590 | 0 |
| B | 0 | 1590 | 0 |
| C | 0 | 1590 | 0 |
| D | 0 | 1590 | 0 |
| Quadrant | Total seconds | Saturated seconds | Saturation percentage |
|---|---|---|---|
| A | 78216 | 827 | 1.057328% |
| B | 78216 | 889 | 1.136596% |
| C | 78216 | 988 | 1.263169% |
| D | 78216 | 1769 | 2.261686% |
Noise dominated data is calculated using 1-second bins in cleaned event files. If a bin has >2000 counts, and if more than 50% of those come from <1% of pixels, then it is considered to be noise-dominated and hence unusable.
| Quadrant | # 1 sec bins | Bins with >0 counts | Bins with >2000 counts | High rate bins dominated by noise | Noise dominated (total time) | Noise dominated (detector-on time) | Marked lightcurve |
|---|---|---|---|---|---|---|---|
| A | 90605 | 78216 | 8 | 8 | 0.01% | 0.01% |  |
| B | 90605 | 78212 | 5 | 5 | 0.01% | 0.01% |  |
| C | 90606 | 78216 | 1 | 1 | 0.00% | 0.00% |  |
| D | 90605 | 78213 | 164 | 164 | 0.18% | 0.21% |  |
Top three noisy pixels from each quadrant. If the there are fewer than three noisy pixels in the level2.evt file, extra rows are filled as -1
| Pixel properties | Quadrant properties | ||||||
|---|---|---|---|---|---|---|---|
| Quadrant | DetID | PixID | Counts | Sigma | Mean | Median | Sigma |
| A | 15 | 174 | 739381 | 814.37 | 4160 | 4084 | 902.9 |
| A | 13 | 210 | 98509 | 104.58 | 4160 | 4084 | 902.9 |
| A | 4 | 2 | 39052 | 38.73 | 4160 | 4084 | 902.9 |
| B | 7 | 220 | 154792 | 193.37 | 4159 | 4059 | 779.5 |
| B | 0 | 219 | 115225 | 142.61 | 4159 | 4059 | 779.5 |
| B | 0 | 189 | 96186 | 118.18 | 4159 | 4059 | 779.5 |
| C | 5 | 218 | 434707 | 467.41 | 3953 | 3936 | 921.6 |
| C | 3 | 233 | 396387 | 425.83 | 3953 | 3936 | 921.6 |
| C | 5 | 219 | 35901 | 34.68 | 3953 | 3936 | 921.6 |
| D | 13 | 189 | 1109401 | 1168.48 | 4065 | 3924 | 946.1 |
| D | 10 | 70 | 1014262 | 1067.91 | 4065 | 3924 | 946.1 |
| D | 13 | 232 | 480348 | 503.57 | 4065 | 3924 | 946.1 |
Histogram calculated using DETX and DETY for each event in the final _common_clean file
| Quadrant A | 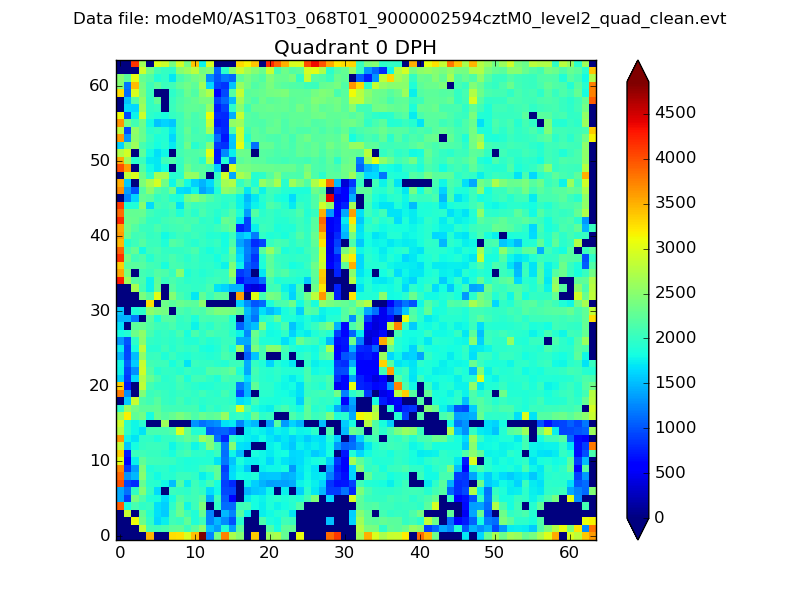 |
 |
Quadrant B |
|---|---|---|---|
| Quadrant D |  |
 |
Quadrant C |
| Plot type | Count rate plots | Images |
|---|---|---|
| Comparison with Poisson distribution Blue bars denote a histogram of data divided into 1 sec bins. Red curve is a Poisson curve with rate = median count rate of data. |
 |
 |
| Quadrant-wise count rates Data is divided into 100 sec bins |
 |
|
| Module-wise count rates for Quadrant A Data is divided into 100 sec bins |
 |
 |
| Module-wise count rates for Quadrant B Data is divided into 100 sec bins |
 |
 |
| Module-wise count rates for Quadrant C Data is divided into 100 sec bins |
 |
 |
| Module-wise count rates for Quadrant D Data is divided into 100 sec bins |
 |
 |
| Parameter | Plot |
|---|---|
| CZT HV Monitor |  |
| D_VDD |  |
| Temperature 1 |  |
| Veto HV Monitor |  |
| Veto LLD |  |
| Alpha Counter |  |
| _CPM_Rate |  |
| CZT Counter |  |
| +2.5 Volts monitor |  |
| +5 Volts monitor |  |
| _ROLL_ROT |  |
| _Roll_DEC |  |
| _Roll_RA |  |
| Veto Counter |  |