| Param | Original file | Final file |
|---|---|---|
| Filename | modeM0/AS1T03_051T01_9000002588cztM0_level2_bc.evt | modeM0/AS1T03_051T01_9000002588cztM0_level2_quad_clean.evt |
| Size (bytes) | 1,265,670,720 | 347,855,040 |
| Size | 1.2 GB | 331.7 MB |
| Events in quadrant A | 6,385,737 | 2,198,117 |
| Events in quadrant B | 7,131,609 | 2,233,104 |
| Events in quadrant C | 6,231,565 | 2,147,511 |
| Events in quadrant D | 16,638,089 | 1,999,032 |
| Mode M9 | |||
|---|---|---|---|
| Quadrant | BADHDUFLAG | Total packets | Discarded packets |
| A | 0 | 61 | 0 |
| B | 0 | 61 | 0 |
| C | 0 | 61 | 0 |
| D | 0 | 61 | 0 |
| Mode M0 | |||
|---|---|---|---|
| Quadrant | BADHDUFLAG | Total packets | Discarded packets |
| A | 0 | 59795 | 0 |
| B | 0 | 62902 | 0 |
| C | 0 | 60030 | 0 |
| D | 0 | 100443 | 0 |
| Mode SS | |||
|---|---|---|---|
| Quadrant | BADHDUFLAG | Total packets | Discarded packets |
| A | 0 | 578 | 0 |
| B | 0 | 578 | 0 |
| C | 0 | 578 | 0 |
| D | 0 | 578 | 0 |
| Quadrant | Total seconds | Saturated seconds | Saturation percentage |
|---|---|---|---|
| A | 28477 | 280 | 0.983250% |
| B | 28477 | 414 | 1.453805% |
| C | 28477 | 412 | 1.446782% |
| D | 28477 | 4298 | 15.092882% |
Noise dominated data is calculated using 1-second bins in cleaned event files. If a bin has >2000 counts, and if more than 50% of those come from <1% of pixels, then it is considered to be noise-dominated and hence unusable.
| Quadrant | # 1 sec bins | Bins with >0 counts | Bins with >2000 counts | High rate bins dominated by noise | Noise dominated (total time) | Noise dominated (detector-on time) | Marked lightcurve |
|---|---|---|---|---|---|---|---|
| A | 34472 | 28476 | 2 | 2 | 0.01% | 0.01% |  |
| B | 34472 | 28476 | 15 | 15 | 0.04% | 0.05% |  |
| C | 34472 | 28478 | 0 | 0 | 0.00% | 0.00% |  |
| D | 34472 | 28476 | 864 | 864 | 2.51% | 3.03% |  |
Top three noisy pixels from each quadrant. If the there are fewer than three noisy pixels in the level2.evt file, extra rows are filled as -1
| Pixel properties | Quadrant properties | ||||||
|---|---|---|---|---|---|---|---|
| Quadrant | DetID | PixID | Counts | Sigma | Mean | Median | Sigma |
| A | 15 | 174 | 93475 | 266.5 | 1625 | 1598 | 344.8 |
| A | 14 | 237 | 30405 | 83.56 | 1625 | 1598 | 344.8 |
| A | 4 | 2 | 12879 | 32.72 | 1625 | 1598 | 344.8 |
| B | 7 | 220 | 146183 | 481.97 | 1631 | 1594 | 300.0 |
| B | 12 | 17 | 134000 | 441.36 | 1631 | 1594 | 300.0 |
| B | 0 | 197 | 99244 | 325.51 | 1631 | 1594 | 300.0 |
| C | 5 | 218 | 98861 | 265.89 | 1576 | 1568 | 365.9 |
| C | 3 | 233 | 50648 | 134.13 | 1576 | 1568 | 365.9 |
| C | 5 | 37 | 14855 | 36.31 | 1576 | 1568 | 365.9 |
| D | 7 | 238 | 4632160 | 13184.82 | 1520 | 1466 | 351.2 |
| D | 1 | 52 | 3758311 | 10696.74 | 1520 | 1466 | 351.2 |
| D | 13 | 189 | 955716 | 2717.01 | 1520 | 1466 | 351.2 |
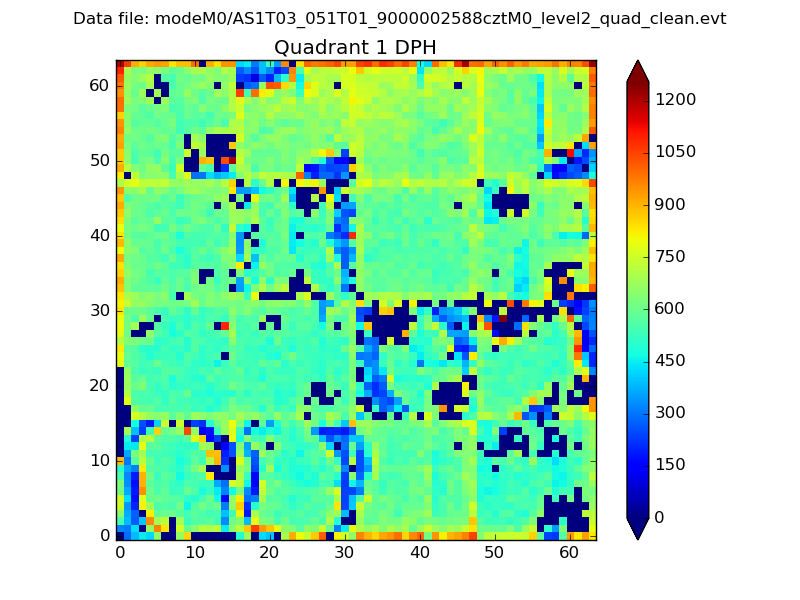
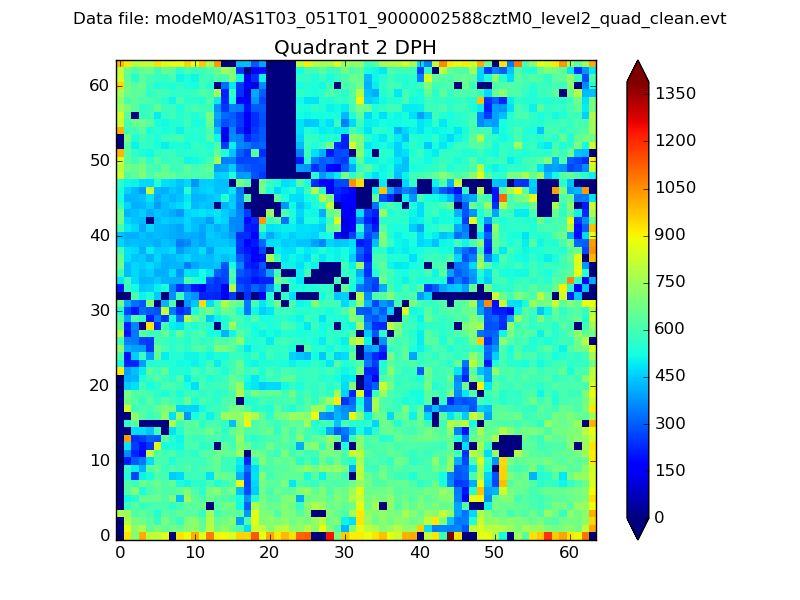
Histogram calculated using DETX and DETY for each event in the final _common_clean file
| Quadrant A |  |
 |
Quadrant B |
|---|---|---|---|
| Quadrant D | 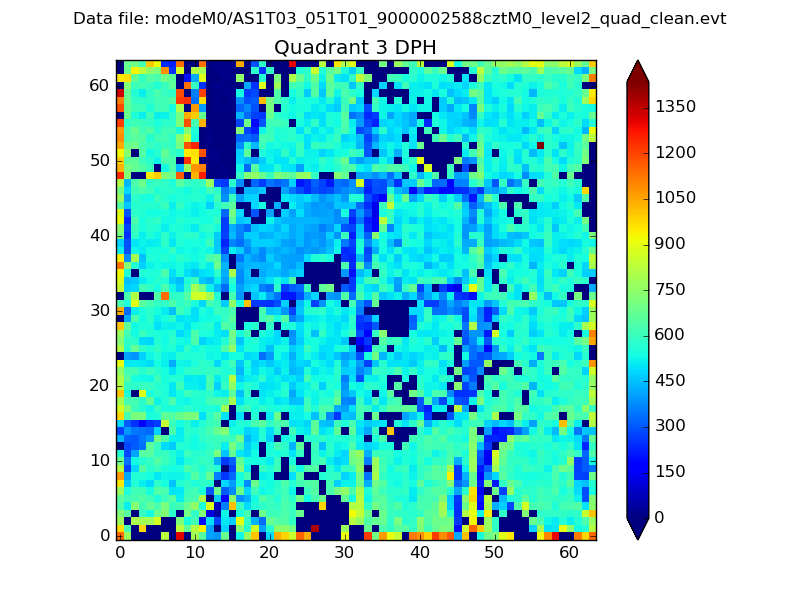 |
 |
Quadrant C |
| Plot type | Count rate plots | Images |
|---|---|---|
| Comparison with Poisson distribution Blue bars denote a histogram of data divided into 1 sec bins. Red curve is a Poisson curve with rate = median count rate of data. |
 |
 |
| Quadrant-wise count rates Data is divided into 100 sec bins |
 |
|
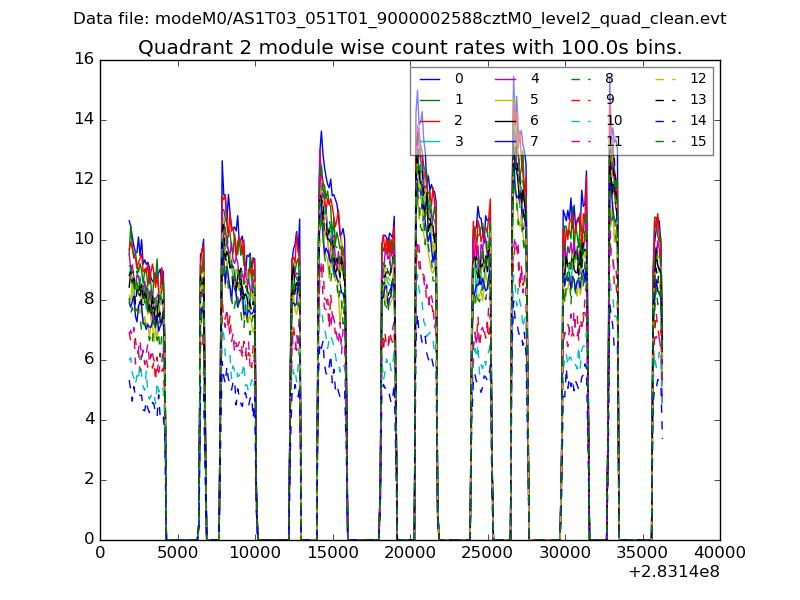
| Module-wise count rates for Quadrant A Data is divided into 100 sec bins |
 |
 |
| Module-wise count rates for Quadrant B Data is divided into 100 sec bins |
 |
 |
| Module-wise count rates for Quadrant C Data is divided into 100 sec bins |
 |
 |
| Module-wise count rates for Quadrant D Data is divided into 100 sec bins |
 |
 |
| Parameter | Plot |
|---|---|
| CZT HV Monitor |  |
| D_VDD |  |
| Temperature 1 |  |
| Veto HV Monitor |  |
| Veto LLD |  |
| Alpha Counter |  |
| _CPM_Rate | 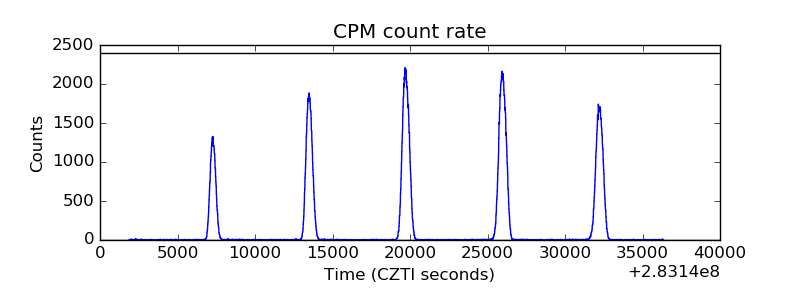 |
| CZT Counter | 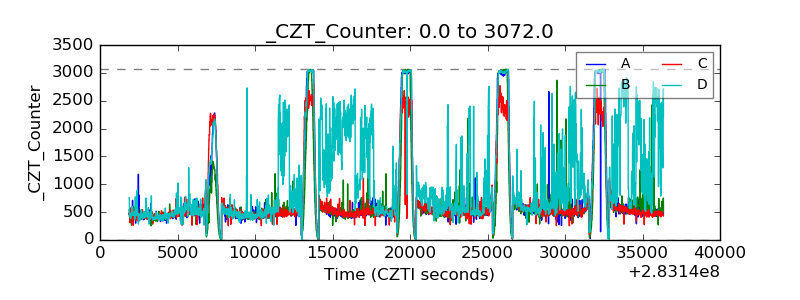 |
| +2.5 Volts monitor |  |
| +5 Volts monitor |  |
| _ROLL_ROT |  |
| _Roll_DEC |  |
| _Roll_RA |  |
| Veto Counter |  |