| Param | Original file | Final file |
|---|---|---|
| Filename | modeM0/AS1A05_194T05_9000002592cztM0_level2_bc.evt | modeM0/AS1A05_194T05_9000002592cztM0_level2_quad_clean.evt |
| Size (bytes) | 2,003,284,800 | 696,288,960 |
| Size | 1.9 GB | 664.0 MB |
| Events in quadrant A | 11,507,486 | 4,370,923 |
| Events in quadrant B | 12,003,788 | 4,452,839 |
| Events in quadrant C | 11,643,853 | 4,284,293 |
| Events in quadrant D | 21,714,586 | 4,158,343 |
| Mode M9 | |||
|---|---|---|---|
| Quadrant | BADHDUFLAG | Total packets | Discarded packets |
| A | 0 | 83 | 0 |
| B | 0 | 83 | 0 |
| C | 0 | 83 | 0 |
| D | 0 | 83 | 0 |
| Mode SS | |||
|---|---|---|---|
| Quadrant | BADHDUFLAG | Total packets | Discarded packets |
| A | 0 | 1132 | 0 |
| B | 0 | 1132 | 0 |
| C | 0 | 1132 | 0 |
| D | 0 | 1132 | 0 |
| Mode M0 | |||
|---|---|---|---|
| Quadrant | BADHDUFLAG | Total packets | Discarded packets |
| A | 0 | 115092 | 0 |
| B | 0 | 116644 | 0 |
| C | 0 | 115521 | 0 |
| D | 0 | 149095 | 0 |
| Quadrant | Total seconds | Saturated seconds | Saturation percentage |
|---|---|---|---|
| A | 55752 | 379 | 0.679796% |
| B | 55752 | 539 | 0.966781% |
| C | 55752 | 606 | 1.086957% |
| D | 55752 | 1973 | 3.538886% |
Noise dominated data is calculated using 1-second bins in cleaned event files. If a bin has >2000 counts, and if more than 50% of those come from <1% of pixels, then it is considered to be noise-dominated and hence unusable.
| Quadrant | # 1 sec bins | Bins with >0 counts | Bins with >2000 counts | High rate bins dominated by noise | Noise dominated (total time) | Noise dominated (detector-on time) | Marked lightcurve |
|---|---|---|---|---|---|---|---|
| A | 63897 | 55754 | 4 | 4 | 0.01% | 0.01% |  |
| B | 63897 | 55753 | 9 | 9 | 0.01% | 0.02% |  |
| C | 63897 | 55754 | 3 | 3 | 0.00% | 0.01% |  |
| D | 63897 | 55753 | 463 | 463 | 0.72% | 0.83% |  |
Top three noisy pixels from each quadrant. If the there are fewer than three noisy pixels in the level2.evt file, extra rows are filled as -1
| Pixel properties | Quadrant properties | ||||||
|---|---|---|---|---|---|---|---|
| Quadrant | DetID | PixID | Counts | Sigma | Mean | Median | Sigma |
| A | 15 | 174 | 204683 | 316.24 | 2940 | 2883 | 638.1 |
| A | 0 | 226 | 19339 | 25.79 | 2940 | 2883 | 638.1 |
| A | 12 | 194 | 19231 | 25.62 | 2940 | 2883 | 638.1 |
| B | 0 | 230 | 138935 | 246.16 | 2954 | 2878 | 552.7 |
| B | 7 | 220 | 137664 | 243.86 | 2954 | 2878 | 552.7 |
| B | 0 | 189 | 85687 | 149.82 | 2954 | 2878 | 552.7 |
| C | 5 | 218 | 468684 | 705.73 | 2839 | 2824 | 660.1 |
| C | 3 | 233 | 111422 | 164.51 | 2839 | 2824 | 660.1 |
| C | 5 | 219 | 69039 | 100.31 | 2839 | 2824 | 660.1 |
| D | 1 | 52 | 4447579 | 6331.17 | 2858 | 2765 | 702.1 |
| D | 11 | 176 | 3000369 | 4269.77 | 2858 | 2765 | 702.1 |
| D | 7 | 238 | 1314967 | 1869.09 | 2858 | 2765 | 702.1 |
Histogram calculated using DETX and DETY for each event in the final _common_clean file
| Quadrant A |  |
 |
Quadrant B |
|---|---|---|---|
| Quadrant D |  |
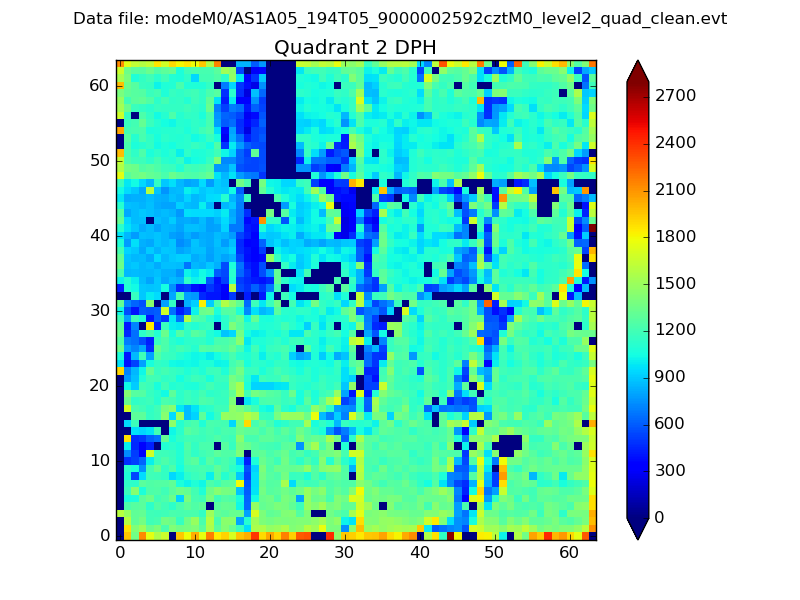 |
Quadrant C |
| Plot type | Count rate plots | Images |
|---|---|---|
| Comparison with Poisson distribution Blue bars denote a histogram of data divided into 1 sec bins. Red curve is a Poisson curve with rate = median count rate of data. |
 |
 |
| Quadrant-wise count rates Data is divided into 100 sec bins |
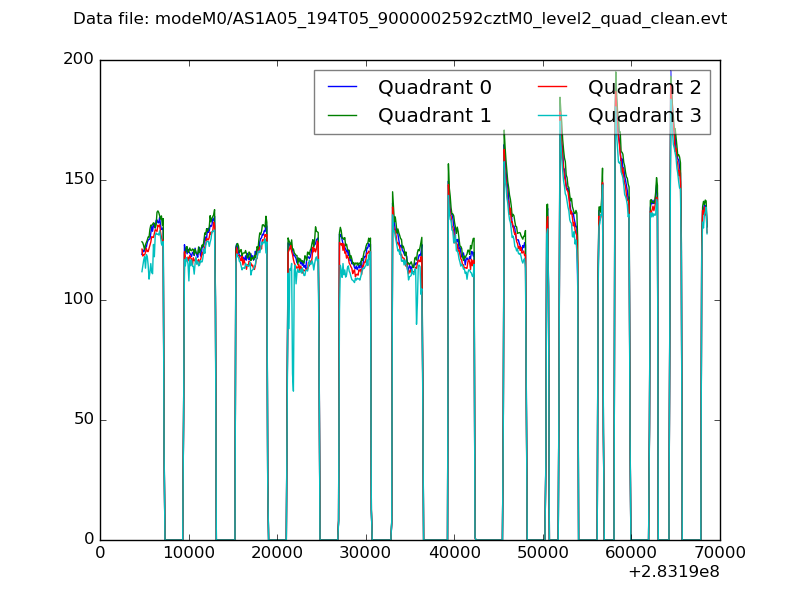 |
|
| Module-wise count rates for Quadrant A Data is divided into 100 sec bins |
 |
 |
| Module-wise count rates for Quadrant B Data is divided into 100 sec bins |
 |
 |
| Module-wise count rates for Quadrant C Data is divided into 100 sec bins |
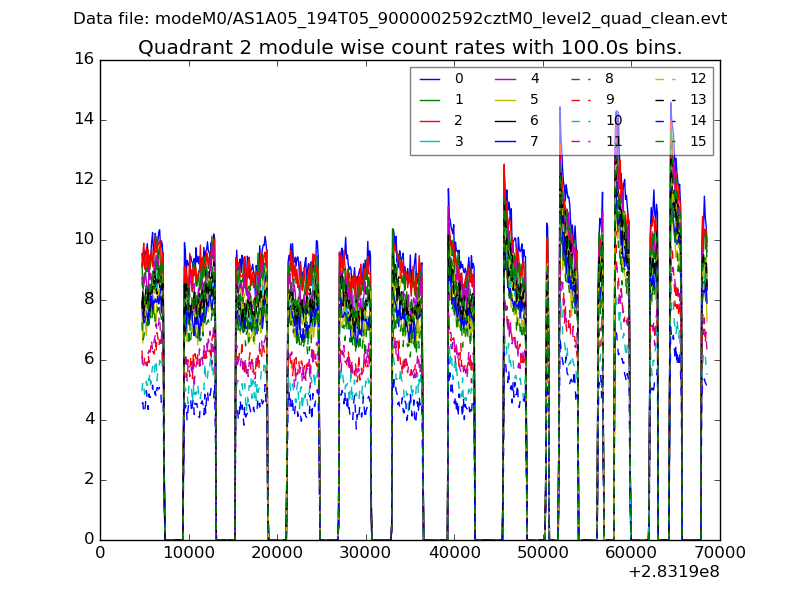 |
 |
| Module-wise count rates for Quadrant D Data is divided into 100 sec bins |
 |
 |
| Parameter | Plot |
|---|---|
| CZT HV Monitor | 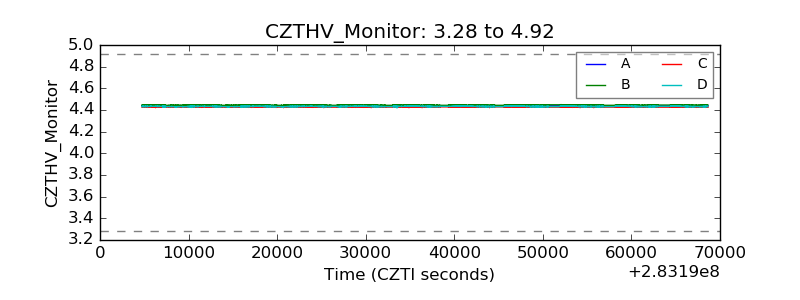 |
| D_VDD |  |
| Temperature 1 |  |
| Veto HV Monitor |  |
| Veto LLD |  |
| Alpha Counter |  |
| _CPM_Rate |  |
| CZT Counter |  |
| +2.5 Volts monitor |  |
| +5 Volts monitor |  |
| _ROLL_ROT | 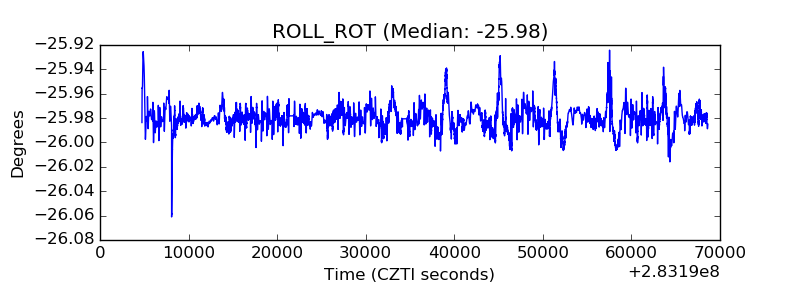 |
| _Roll_DEC |  |
| _Roll_RA |  |
| Veto Counter |  |