| Param | Original file | Final file |
|---|---|---|
| Filename | modeM0/AS1A05_198T01_9000002586cztM0_level2_bc.evt | modeM0/AS1A05_198T01_9000002586cztM0_level2_quad_clean.evt |
| Size (bytes) | 1,126,725,120 | 378,270,720 |
| Size | 1.0 GB | 360.7 MB |
| Events in quadrant A | 7,321,355 | 2,368,511 |
| Events in quadrant B | 6,902,272 | 2,402,315 |
| Events in quadrant C | 6,260,897 | 2,315,120 |
| Events in quadrant D | 11,516,085 | 2,235,540 |
| Mode M0 | |||
|---|---|---|---|
| Quadrant | BADHDUFLAG | Total packets | Discarded packets |
| A | 0 | 68922 | 0 |
| B | 0 | 66446 | 0 |
| C | 0 | 63656 | 0 |
| D | 0 | 84478 | 0 |
| Mode SS | |||
|---|---|---|---|
| Quadrant | BADHDUFLAG | Total packets | Discarded packets |
| A | 0 | 632 | 0 |
| B | 0 | 632 | 0 |
| C | 0 | 632 | 0 |
| D | 0 | 632 | 0 |
| Mode M9 | |||
|---|---|---|---|
| Quadrant | BADHDUFLAG | Total packets | Discarded packets |
| A | 0 | 21 | 0 |
| B | 0 | 21 | 0 |
| C | 0 | 21 | 0 |
| D | 0 | 21 | 0 |
| Quadrant | Total seconds | Saturated seconds | Saturation percentage |
|---|---|---|---|
| A | 31070 | 570 | 1.834567% |
| B | 31070 | 342 | 1.100740% |
| C | 31070 | 314 | 1.010621% |
| D | 31070 | 1465 | 4.715159% |
Noise dominated data is calculated using 1-second bins in cleaned event files. If a bin has >2000 counts, and if more than 50% of those come from <1% of pixels, then it is considered to be noise-dominated and hence unusable.
| Quadrant | # 1 sec bins | Bins with >0 counts | Bins with >2000 counts | High rate bins dominated by noise | Noise dominated (total time) | Noise dominated (detector-on time) | Marked lightcurve |
|---|---|---|---|---|---|---|---|
| A | 33150 | 31073 | 13 | 13 | 0.04% | 0.04% |  |
| B | 33150 | 31070 | 0 | 0 | 0.00% | 0.00% | 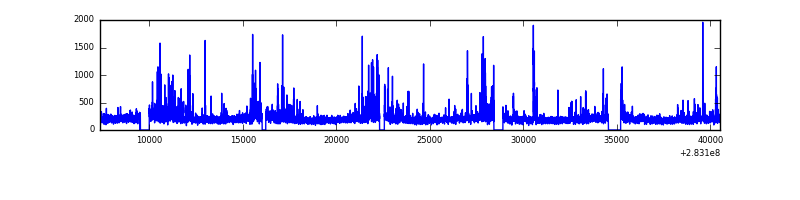 |
| C | 33150 | 31072 | 0 | 0 | 0.00% | 0.00% | 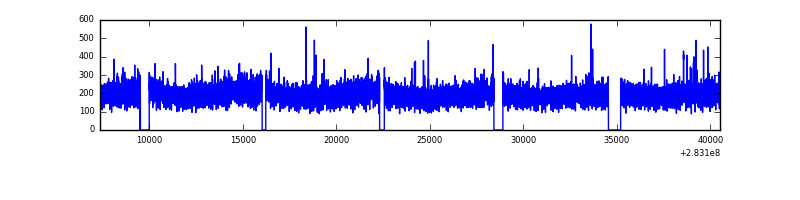 |
| D | 33150 | 31072 | 85 | 85 | 0.26% | 0.27% |  |
Top three noisy pixels from each quadrant. If the there are fewer than three noisy pixels in the level2.evt file, extra rows are filled as -1
| Pixel properties | Quadrant properties | ||||||
|---|---|---|---|---|---|---|---|
| Quadrant | DetID | PixID | Counts | Sigma | Mean | Median | Sigma |
| A | 15 | 174 | 1301360 | 3767.88 | 1557 | 1521 | 345.0 |
| A | 13 | 210 | 13777 | 35.53 | 1557 | 1521 | 345.0 |
| A | 15 | 191 | 11451 | 28.78 | 1557 | 1521 | 345.0 |
| B | 7 | 220 | 122023 | 400.43 | 1573 | 1530 | 300.9 |
| B | 0 | 230 | 106417 | 348.56 | 1573 | 1530 | 300.9 |
| B | 0 | 197 | 94744 | 309.77 | 1573 | 1530 | 300.9 |
| C | 5 | 218 | 317146 | 891.58 | 1504 | 1491 | 354.0 |
| C | 5 | 219 | 73505 | 203.41 | 1504 | 1491 | 354.0 |
| C | 5 | 37 | 30070 | 80.72 | 1504 | 1491 | 354.0 |
| D | 7 | 238 | 1949009 | 5460.24 | 1514 | 1457 | 356.7 |
| D | 10 | 70 | 1778817 | 4983.09 | 1514 | 1457 | 356.7 |
| D | 13 | 189 | 951399 | 2663.3 | 1514 | 1457 | 356.7 |
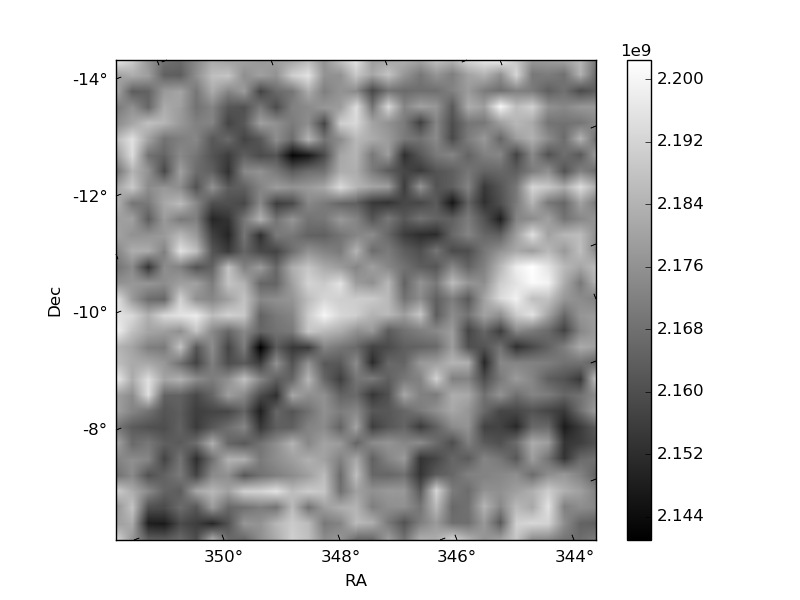
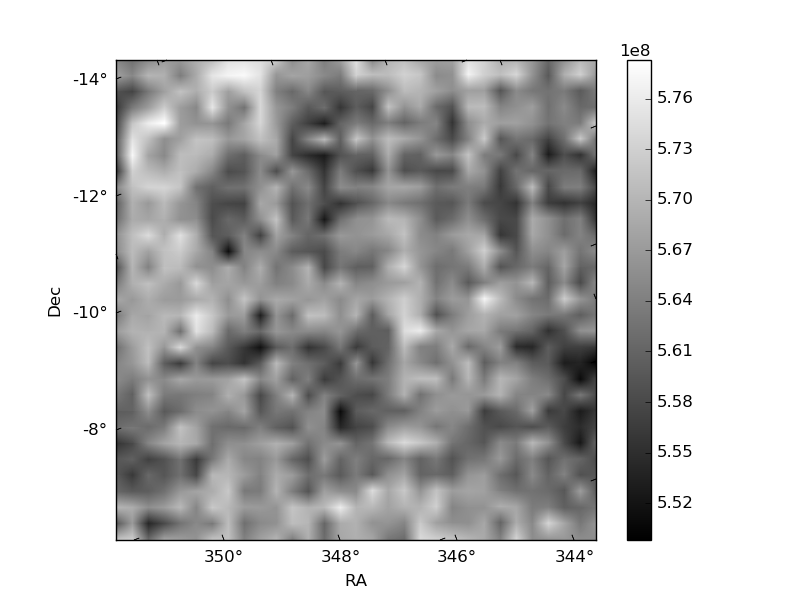
Histogram calculated using DETX and DETY for each event in the final _common_clean file
| Quadrant A |  |
 |
Quadrant B |
|---|---|---|---|
| Quadrant D |  |
 |
Quadrant C |
| Plot type | Count rate plots | Images |
|---|---|---|
| Comparison with Poisson distribution Blue bars denote a histogram of data divided into 1 sec bins. Red curve is a Poisson curve with rate = median count rate of data. |
 |
 |
| Quadrant-wise count rates Data is divided into 100 sec bins |
 |
|
| Module-wise count rates for Quadrant A Data is divided into 100 sec bins |
 |
 |
| Module-wise count rates for Quadrant B Data is divided into 100 sec bins |
 |
 |
| Module-wise count rates for Quadrant C Data is divided into 100 sec bins |
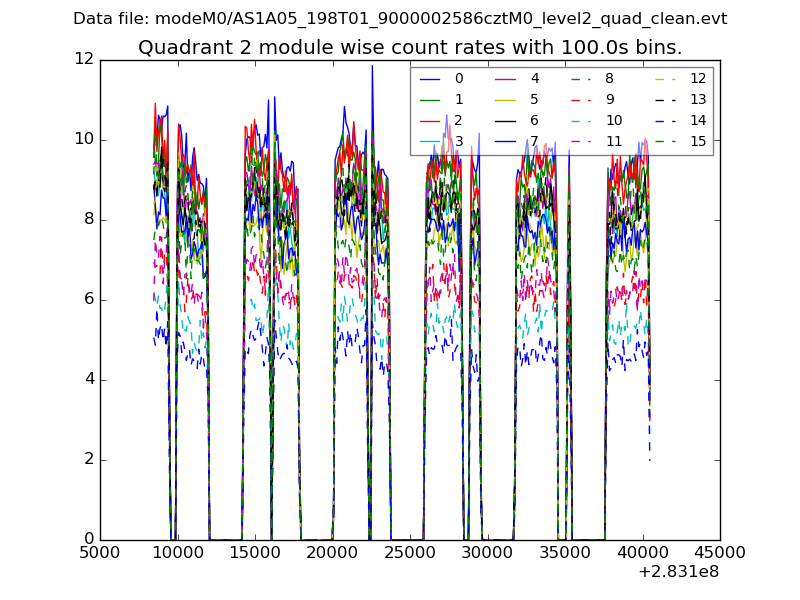 |
 |
| Module-wise count rates for Quadrant D Data is divided into 100 sec bins |
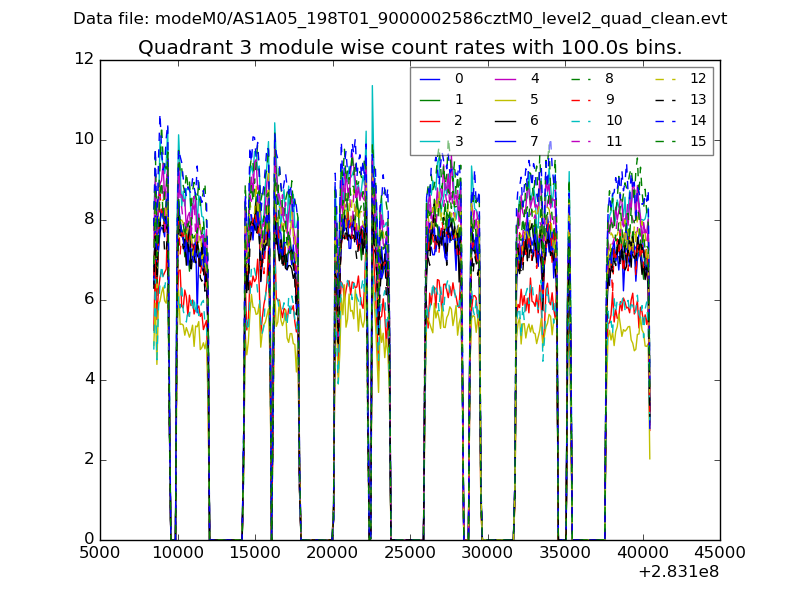 |
 |
| Parameter | Plot |
|---|---|
| CZT HV Monitor |  |
| D_VDD | 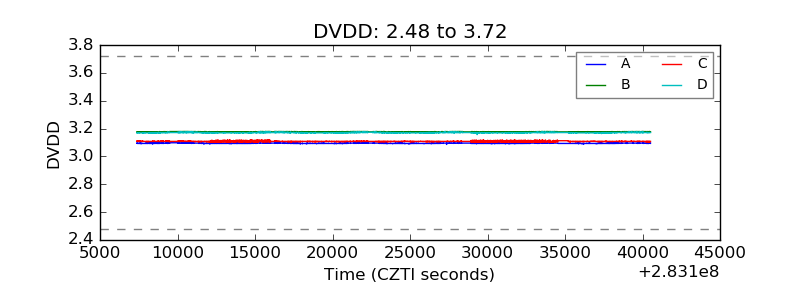 |
| Temperature 1 |  |
| Veto HV Monitor | 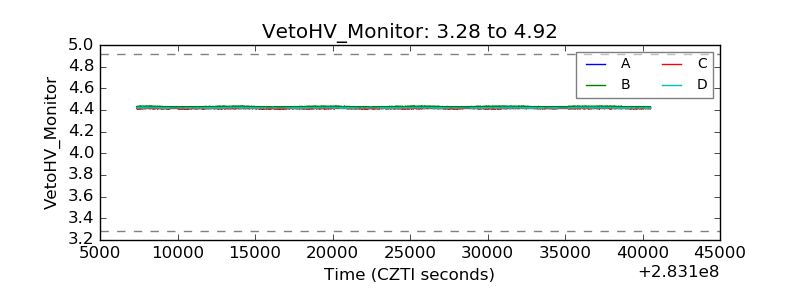 |
| Veto LLD | 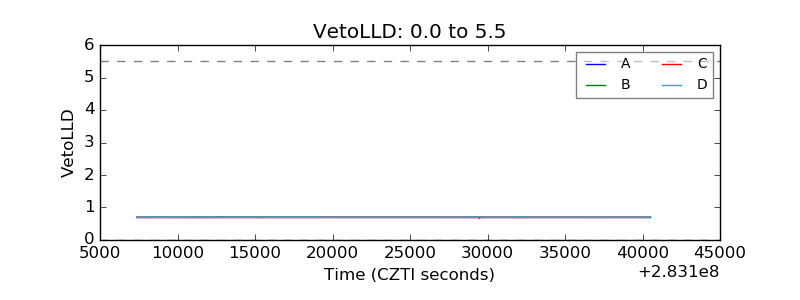 |
| Alpha Counter |  |
| _CPM_Rate |  |
| CZT Counter |  |
| +2.5 Volts monitor |  |
| +5 Volts monitor |  |
| _ROLL_ROT |  |
| _Roll_DEC | 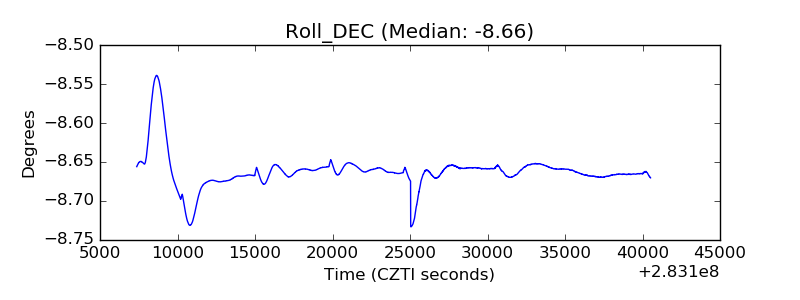 |
| _Roll_RA |  |
| Veto Counter |  |