| Param | Original file | Final file |
|---|---|---|
| Filename | modeM0/AS1A05_196T01_9000002584cztM0_level2_bc.evt | modeM0/AS1A05_196T01_9000002584cztM0_level2_quad_clean.evt |
| Size (bytes) | 1,117,869,120 | 268,594,560 |
| Size | 1.0 GB | 256.2 MB |
| Events in quadrant A | 5,274,850 | 1,738,593 |
| Events in quadrant B | 5,269,233 | 1,750,998 |
| Events in quadrant C | 4,773,403 | 1,674,607 |
| Events in quadrant D | 17,081,412 | 1,502,571 |
| Mode SS | |||
|---|---|---|---|
| Quadrant | BADHDUFLAG | Total packets | Discarded packets |
| A | 0 | 432 | 0 |
| B | 0 | 432 | 0 |
| C | 0 | 432 | 0 |
| D | 0 | 432 | 0 |
| Mode M0 | |||
|---|---|---|---|
| Quadrant | BADHDUFLAG | Total packets | Discarded packets |
| A | 0 | 47111 | 0 |
| B | 0 | 46980 | 0 |
| C | 0 | 45774 | 0 |
| D | 0 | 87005 | 0 |
| Mode M9 | |||
|---|---|---|---|
| Quadrant | BADHDUFLAG | Total packets | Discarded packets |
| A | 0 | 48 | 0 |
| B | 0 | 48 | 0 |
| C | 0 | 48 | 0 |
| D | 0 | 48 | 0 |
| Quadrant | Total seconds | Saturated seconds | Saturation percentage |
|---|---|---|---|
| A | 21316 | 643 | 3.016513% |
| B | 21316 | 501 | 2.350347% |
| C | 21316 | 513 | 2.406643% |
| D | 21316 | 4775 | 22.401013% |
Noise dominated data is calculated using 1-second bins in cleaned event files. If a bin has >2000 counts, and if more than 50% of those come from <1% of pixels, then it is considered to be noise-dominated and hence unusable.
| Quadrant | # 1 sec bins | Bins with >0 counts | Bins with >2000 counts | High rate bins dominated by noise | Noise dominated (total time) | Noise dominated (detector-on time) | Marked lightcurve |
|---|---|---|---|---|---|---|---|
| A | 26026 | 21313 | 34 | 34 | 0.13% | 0.16% |  |
| B | 26026 | 21314 | 0 | 0 | 0.00% | 0.00% |  |
| C | 26026 | 21314 | 0 | 0 | 0.00% | 0.00% | 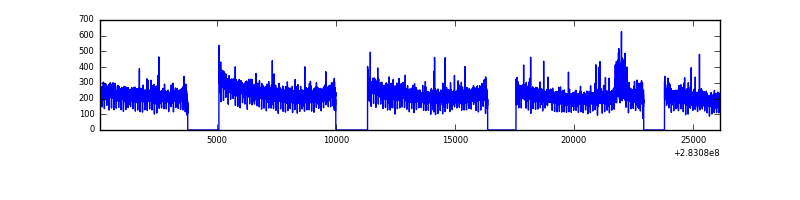 |
| D | 26026 | 21314 | 2443 | 2443 | 9.39% | 11.46% |  |
Top three noisy pixels from each quadrant. If the there are fewer than three noisy pixels in the level2.evt file, extra rows are filled as -1
| Pixel properties | Quadrant properties | ||||||
|---|---|---|---|---|---|---|---|
| Quadrant | DetID | PixID | Counts | Sigma | Mean | Median | Sigma |
| A | 15 | 174 | 353257 | 1341.75 | 1232 | 1212 | 262.4 |
| A | 0 | 23 | 146774 | 554.78 | 1232 | 1212 | 262.4 |
| A | 4 | 2 | 21824 | 78.56 | 1232 | 1212 | 262.4 |
| B | 0 | 189 | 125389 | 550.23 | 1239 | 1217 | 225.7 |
| B | 0 | 197 | 88356 | 386.13 | 1239 | 1217 | 225.7 |
| B | 10 | 16 | 62732 | 272.58 | 1239 | 1217 | 225.7 |
| C | 5 | 218 | 106320 | 382.69 | 1184 | 1180 | 274.7 |
| C | 7 | 220 | 66853 | 239.04 | 1184 | 1180 | 274.7 |
| C | 3 | 233 | 23556 | 81.44 | 1184 | 1180 | 274.7 |
| D | 11 | 176 | 9975226 | 39295.18 | 1103 | 1068 | 253.8 |
| D | 7 | 238 | 1160519 | 4567.89 | 1103 | 1068 | 253.8 |
| D | 10 | 70 | 1063505 | 4185.68 | 1103 | 1068 | 253.8 |
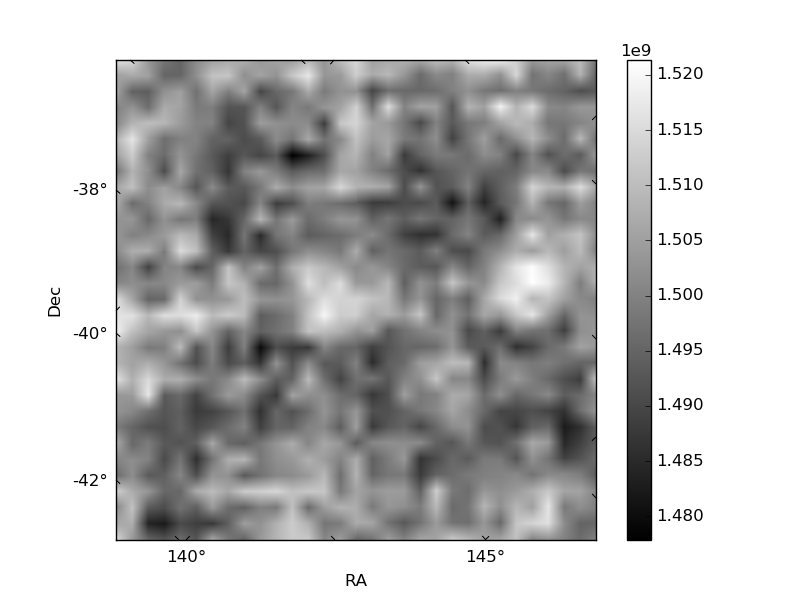
Histogram calculated using DETX and DETY for each event in the final _common_clean file
| Quadrant A |  |
 |
Quadrant B |
|---|---|---|---|
| Quadrant D |  |
 |
Quadrant C |
| Plot type | Count rate plots | Images |
|---|---|---|
| Comparison with Poisson distribution Blue bars denote a histogram of data divided into 1 sec bins. Red curve is a Poisson curve with rate = median count rate of data. |
 |
 |
| Quadrant-wise count rates Data is divided into 100 sec bins |
 |
|
| Module-wise count rates for Quadrant A Data is divided into 100 sec bins |
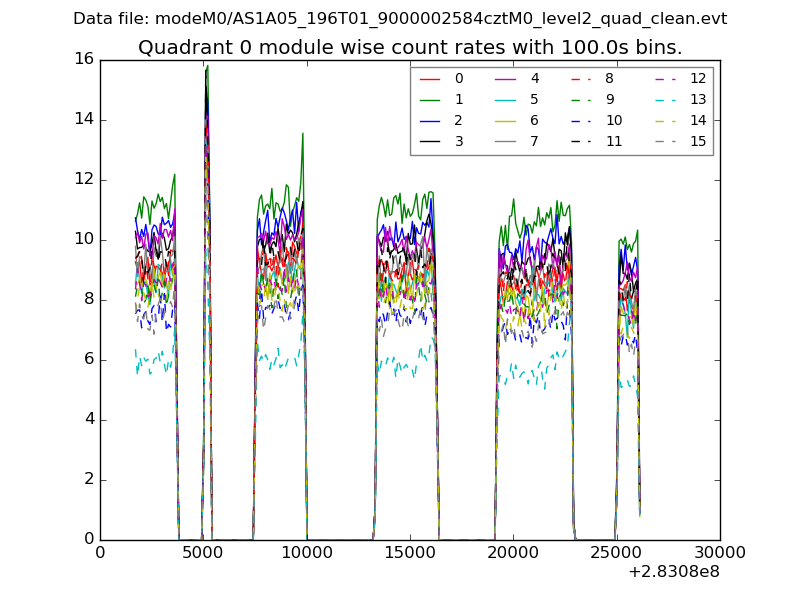 |
 |
| Module-wise count rates for Quadrant B Data is divided into 100 sec bins |
 |
 |
| Module-wise count rates for Quadrant C Data is divided into 100 sec bins |
 |
 |
| Module-wise count rates for Quadrant D Data is divided into 100 sec bins |
 |
 |
| Parameter | Plot |
|---|---|
| CZT HV Monitor | 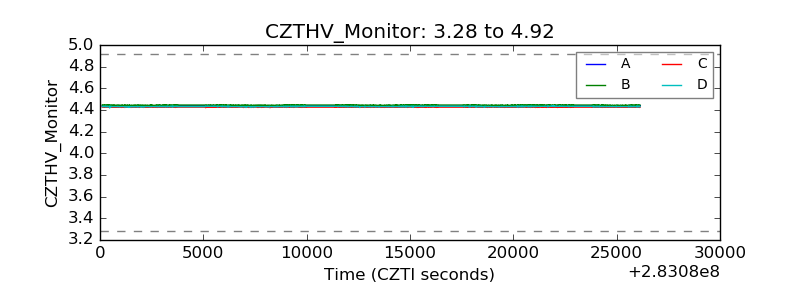 |
| D_VDD |  |
| Temperature 1 |  |
| Veto HV Monitor |  |
| Veto LLD | 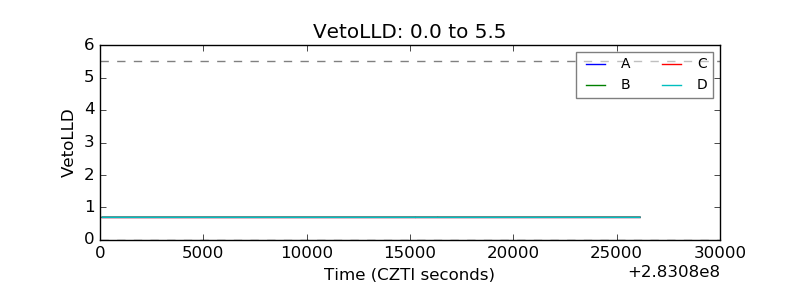 |
| Alpha Counter |  |
| _CPM_Rate |  |
| CZT Counter |  |
| +2.5 Volts monitor |  |
| +5 Volts monitor |  |
| _ROLL_ROT |  |
| _Roll_DEC | 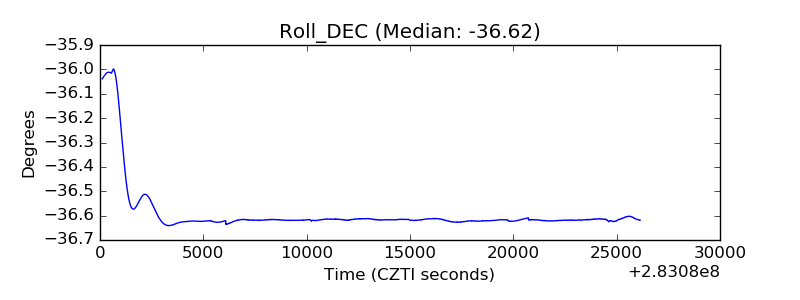 |
| _Roll_RA |  |
| Veto Counter |  |