| Param | Original file | Final file |
|---|---|---|
| Filename | modeM0/AS1T03_067T01_9000002582cztM0_level2_bc.evt | modeM0/AS1T03_067T01_9000002582cztM0_level2_quad_clean.evt |
| Size (bytes) | 4,487,094,720 | 1,558,589,760 |
| Size | 4.2 GB | 1.5 GB |
| Events in quadrant A | 26,897,654 | 10,102,795 |
| Events in quadrant B | 28,158,181 | 10,227,643 |
| Events in quadrant C | 24,149,146 | 9,797,634 |
| Events in quadrant D | 49,097,978 | 9,441,081 |
| Mode M9 | |||
|---|---|---|---|
| Quadrant | BADHDUFLAG | Total packets | Discarded packets |
| A | 0 | 183 | 0 |
| B | 0 | 183 | 0 |
| C | 0 | 183 | 0 |
| D | 0 | 183 | 0 |
| Mode M0 | |||
|---|---|---|---|
| Quadrant | BADHDUFLAG | Total packets | Discarded packets |
| A | 0 | 242905 | 0 |
| B | 0 | 251697 | 0 |
| C | 0 | 234600 | 0 |
| D | 0 | 321471 | 0 |
| Mode SS | |||
|---|---|---|---|
| Quadrant | BADHDUFLAG | Total packets | Discarded packets |
| A | 0 | 2270 | 0 |
| B | 0 | 2270 | 0 |
| C | 0 | 2270 | 0 |
| D | 0 | 2270 | 0 |
| Quadrant | Total seconds | Saturated seconds | Saturation percentage |
|---|---|---|---|
| A | 111505 | 2358 | 2.114703% |
| B | 111505 | 1716 | 1.538944% |
| C | 111505 | 1428 | 1.280660% |
| D | 111505 | 7459 | 6.689386% |
Noise dominated data is calculated using 1-second bins in cleaned event files. If a bin has >2000 counts, and if more than 50% of those come from <1% of pixels, then it is considered to be noise-dominated and hence unusable.
| Quadrant | # 1 sec bins | Bins with >0 counts | Bins with >2000 counts | High rate bins dominated by noise | Noise dominated (total time) | Noise dominated (detector-on time) | Marked lightcurve |
|---|---|---|---|---|---|---|---|
| A | 129635 | 111506 | 374 | 374 | 0.29% | 0.34% |  |
| B | 129635 | 111506 | 30 | 30 | 0.02% | 0.03% |  |
| C | 129635 | 111504 | 0 | 0 | 0.00% | 0.00% |  |
| D | 129634 | 111503 | 1953 | 1953 | 1.51% | 1.75% |  |
Top three noisy pixels from each quadrant. If the there are fewer than three noisy pixels in the level2.evt file, extra rows are filled as -1
| Pixel properties | Quadrant properties | ||||||
|---|---|---|---|---|---|---|---|
| Quadrant | DetID | PixID | Counts | Sigma | Mean | Median | Sigma |
| A | 3 | 64 | 2439400 | 1911.45 | 5906 | 5816 | 1273.2 |
| A | 14 | 237 | 1001427 | 782.0 | 5906 | 5816 | 1273.2 |
| A | 15 | 174 | 497624 | 386.29 | 5906 | 5816 | 1273.2 |
| B | 7 | 220 | 2033584 | 1843.85 | 5944 | 5814 | 1099.7 |
| B | 4 | 216 | 582529 | 524.41 | 5944 | 5814 | 1099.7 |
| B | 15 | 35 | 545141 | 490.41 | 5944 | 5814 | 1099.7 |
| C | 3 | 233 | 1541861 | 1153.73 | 5703 | 5693 | 1331.5 |
| C | 5 | 218 | 446518 | 331.08 | 5703 | 5693 | 1331.5 |
| C | 5 | 219 | 78573 | 54.74 | 5703 | 5693 | 1331.5 |
| D | 11 | 176 | 13023307 | 9581.68 | 5743 | 5542 | 1358.6 |
| D | 13 | 189 | 4493032 | 3303.0 | 5743 | 5542 | 1358.6 |
| D | 13 | 232 | 2671744 | 1962.45 | 5743 | 5542 | 1358.6 |
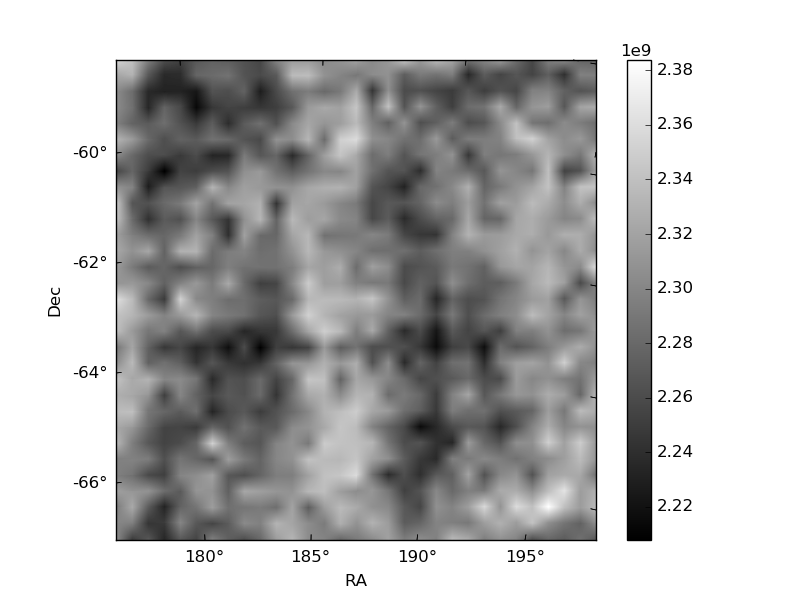
Histogram calculated using DETX and DETY for each event in the final _common_clean file
| Quadrant A |  |
 |
Quadrant B |
|---|---|---|---|
| Quadrant D |  |
 |
Quadrant C |
| Plot type | Count rate plots | Images |
|---|---|---|
| Comparison with Poisson distribution Blue bars denote a histogram of data divided into 1 sec bins. Red curve is a Poisson curve with rate = median count rate of data. |
 |
 |
| Quadrant-wise count rates Data is divided into 100 sec bins |
 |
|
| Module-wise count rates for Quadrant A Data is divided into 100 sec bins |
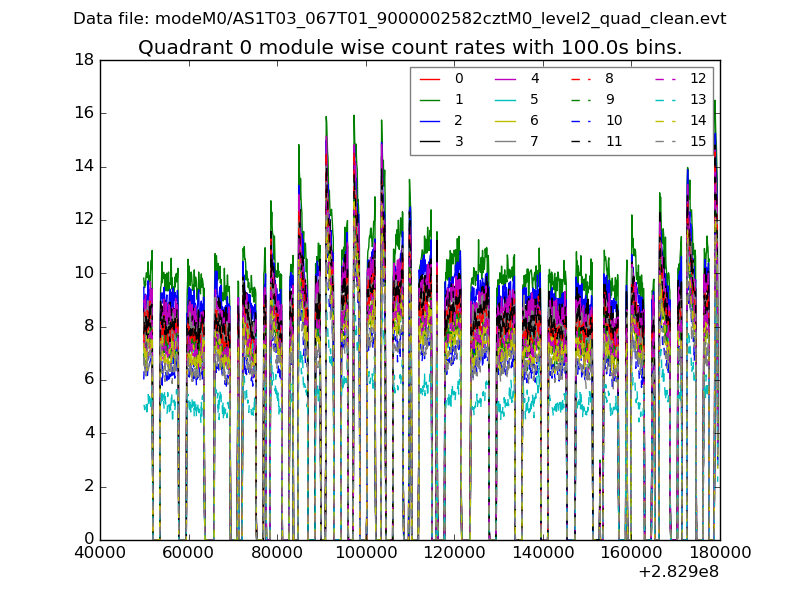 |
 |
| Module-wise count rates for Quadrant B Data is divided into 100 sec bins |
 |
 |
| Module-wise count rates for Quadrant C Data is divided into 100 sec bins |
 |
 |
| Module-wise count rates for Quadrant D Data is divided into 100 sec bins |
 |
 |
| Parameter | Plot |
|---|---|
| CZT HV Monitor |  |
| D_VDD |  |
| Temperature 1 |  |
| Veto HV Monitor |  |
| Veto LLD |  |
| Alpha Counter |  |
| _CPM_Rate |  |
| CZT Counter |  |
| +2.5 Volts monitor |  |
| +5 Volts monitor |  |
| _ROLL_ROT |  |
| _Roll_DEC |  |
| _Roll_RA |  |
| Veto Counter |  |