| Param | Original file | Final file |
|---|---|---|
| Filename | modeM0/AS1A05_198T01_9000002578cztM0_level2_bc.evt | modeM0/AS1A05_198T01_9000002578cztM0_level2_quad_clean.evt |
| Size (bytes) | 4,381,323,840 | 1,562,448,960 |
| Size | 4.1 GB | 1.5 GB |
| Events in quadrant A | 32,259,469 | 9,830,548 |
| Events in quadrant B | 29,043,377 | 10,064,677 |
| Events in quadrant C | 26,117,417 | 9,597,590 |
| Events in quadrant D | 36,902,777 | 9,416,172 |
| Mode M0 | |||
|---|---|---|---|
| Quadrant | BADHDUFLAG | Total packets | Discarded packets |
| A | 0 | 278407 | 0 |
| B | 0 | 269641 | 0 |
| C | 0 | 256273 | 0 |
| D | 0 | 296525 | 0 |
| Mode M9 | |||
|---|---|---|---|
| Quadrant | BADHDUFLAG | Total packets | Discarded packets |
| A | 0 | 173 | 0 |
| B | 0 | 173 | 0 |
| C | 0 | 173 | 0 |
| D | 0 | 173 | 0 |
| Mode SS | |||
|---|---|---|---|
| Quadrant | BADHDUFLAG | Total packets | Discarded packets |
| A | 0 | 2498 | 0 |
| B | 0 | 2498 | 0 |
| C | 0 | 2498 | 0 |
| D | 0 | 2498 | 0 |
| Quadrant | Total seconds | Saturated seconds | Saturation percentage |
|---|---|---|---|
| A | 122852 | 3648 | 2.969427% |
| B | 122852 | 2046 | 1.665419% |
| C | 122852 | 1873 | 1.524599% |
| D | 122852 | 3047 | 2.480220% |
Noise dominated data is calculated using 1-second bins in cleaned event files. If a bin has >2000 counts, and if more than 50% of those come from <1% of pixels, then it is considered to be noise-dominated and hence unusable.
| Quadrant | # 1 sec bins | Bins with >0 counts | Bins with >2000 counts | High rate bins dominated by noise | Noise dominated (total time) | Noise dominated (detector-on time) | Marked lightcurve |
|---|---|---|---|---|---|---|---|
| A | 139762 | 122845 | 1269 | 1269 | 0.91% | 1.03% |  |
| B | 139762 | 122846 | 17 | 17 | 0.01% | 0.01% |  |
| C | 139762 | 122853 | 1 | 1 | 0.00% | 0.00% | 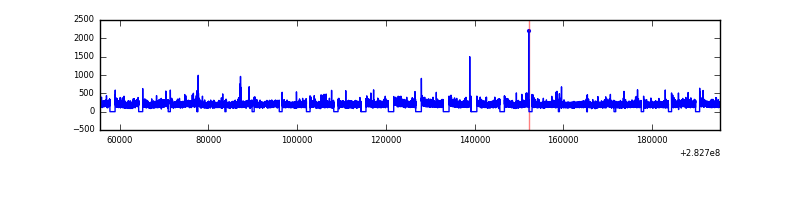 |
| D | 139762 | 122852 | 429 | 429 | 0.31% | 0.35% |  |
Top three noisy pixels from each quadrant. If the there are fewer than three noisy pixels in the level2.evt file, extra rows are filled as -1
| Pixel properties | Quadrant properties | ||||||
|---|---|---|---|---|---|---|---|
| Quadrant | DetID | PixID | Counts | Sigma | Mean | Median | Sigma |
| A | 10 | 253 | 7291210 | 5308.4 | 6366 | 6242 | 1372.3 |
| A | 4 | 2 | 136449 | 94.88 | 6366 | 6242 | 1372.3 |
| A | 14 | 238 | 109621 | 75.33 | 6366 | 6242 | 1372.3 |
| B | 7 | 220 | 827101 | 675.64 | 6470 | 6301 | 1214.9 |
| B | 0 | 219 | 745013 | 608.07 | 6470 | 6301 | 1214.9 |
| B | 15 | 35 | 479953 | 389.88 | 6470 | 6301 | 1214.9 |
| C | 5 | 218 | 1598009 | 1117.4 | 6122 | 6083 | 1424.7 |
| C | 3 | 233 | 486281 | 337.06 | 6122 | 6083 | 1424.7 |
| C | 5 | 219 | 380184 | 262.59 | 6122 | 6083 | 1424.7 |
| D | 13 | 232 | 3705294 | 2531.67 | 6277 | 6046 | 1461.2 |
| D | 11 | 176 | 2159575 | 1473.82 | 6277 | 6046 | 1461.2 |
| D | 1 | 52 | 1454653 | 991.39 | 6277 | 6046 | 1461.2 |
Histogram calculated using DETX and DETY for each event in the final _common_clean file
| Quadrant A |  |
 |
Quadrant B |
|---|---|---|---|
| Quadrant D |  |
 |
Quadrant C |
| Plot type | Count rate plots | Images |
|---|---|---|
| Comparison with Poisson distribution Blue bars denote a histogram of data divided into 1 sec bins. Red curve is a Poisson curve with rate = median count rate of data. |
 |
 |
| Quadrant-wise count rates Data is divided into 100 sec bins |
 |
|
| Module-wise count rates for Quadrant A Data is divided into 100 sec bins |
 |
 |
| Module-wise count rates for Quadrant B Data is divided into 100 sec bins |
 |
 |
| Module-wise count rates for Quadrant C Data is divided into 100 sec bins |
 |
 |
| Module-wise count rates for Quadrant D Data is divided into 100 sec bins |
 |
 |
| Parameter | Plot |
|---|---|
| CZT HV Monitor |  |
| D_VDD |  |
| Temperature 1 |  |
| Veto HV Monitor |  |
| Veto LLD |  |
| Alpha Counter | 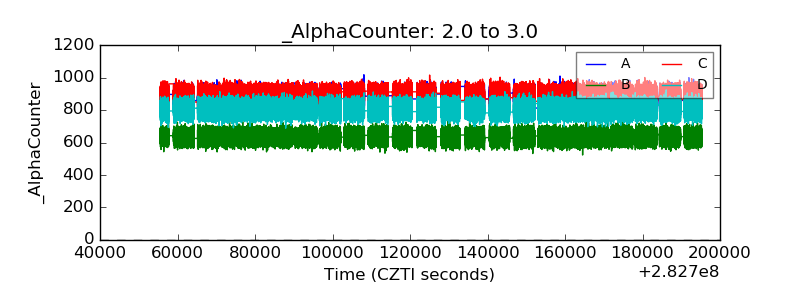 |
| _CPM_Rate |  |
| CZT Counter |  |
| +2.5 Volts monitor |  |
| +5 Volts monitor |  |
| _ROLL_ROT |  |
| _Roll_DEC |  |
| _Roll_RA |  |
| Veto Counter |  |