| Param | Original file | Final file |
|---|---|---|
| Filename | modeM0/AS1A05_182T03_9000002576cztM0_level2.evt | modeM0/AS1A05_182T03_9000002576cztM0_level2_quad_clean.evt |
| Size (bytes) | 1,147,858,560 | 203,806,080 |
| Size | 1.1 GB | 194.4 MB |
| Events in quadrant A | 6,373,281 | 1,407,448 |
| Events in quadrant B | 6,685,718 | 1,403,062 |
| Events in quadrant C | 6,493,975 | 1,315,089 |
| Events in quadrant D | 14,367,613 | 1,183,739 |
| Mode SS | |||
|---|---|---|---|
| Quadrant | BADHDUFLAG | Total packets | Discarded packets |
| A | 0 | 256 | 0 |
| B | 0 | 256 | 0 |
| C | 0 | 256 | 0 |
| D | 0 | 256 | 0 |
| Mode M9 | |||
|---|---|---|---|
| Quadrant | BADHDUFLAG | Total packets | Discarded packets |
| A | 0 | 39 | 0 |
| B | 0 | 39 | 0 |
| C | 0 | 39 | 0 |
| D | 0 | 39 | 0 |
| Mode M0 | |||
|---|---|---|---|
| Quadrant | BADHDUFLAG | Total packets | Discarded packets |
| A | 0 | 26801 | 0 |
| B | 0 | 27573 | 0 |
| C | 0 | 26469 | 0 |
| D | 0 | 51254 | 0 |
| Quadrant | Total seconds | Saturated seconds | Saturation percentage |
|---|---|---|---|
| A | 12486 | 175 | 1.401570% |
| B | 12486 | 191 | 1.529713% |
| C | 12486 | 204 | 1.633830% |
| D | 12486 | 2274 | 18.212398% |
Noise dominated data is calculated using 1-second bins in cleaned event files. If a bin has >2000 counts, and if more than 50% of those come from <1% of pixels, then it is considered to be noise-dominated and hence unusable.
| Quadrant | # 1 sec bins | Bins with >0 counts | Bins with >2000 counts | High rate bins dominated by noise | Noise dominated (total time) | Noise dominated (detector-on time) | Marked lightcurve |
|---|---|---|---|---|---|---|---|
| A | 16456 | 12489 | 3 | 3 | 0.02% | 0.02% |  |
| B | 16456 | 12490 | 21 | 21 | 0.13% | 0.17% | 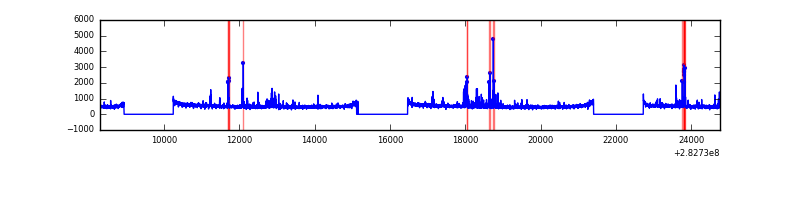 |
| C | 16456 | 12490 | 0 | 0 | 0.00% | 0.00% |  |
| D | 16456 | 12490 | 2060 | 2060 | 12.52% | 16.49% |  |
Top three noisy pixels from each quadrant. If the there are fewer than three noisy pixels in the level2.evt file, extra rows are filled as -1
| Pixel properties | Quadrant properties | ||||||
|---|---|---|---|---|---|---|---|
| Quadrant | DetID | PixID | Counts | Sigma | Mean | Median | Sigma |
| A | 6 | 16 | 87045 | 264.03 | 1636 | 1603 | 323.6 |
| A | 0 | 226 | 14380 | 39.48 | 1636 | 1603 | 323.6 |
| A | 12 | 194 | 12458 | 33.54 | 1636 | 1603 | 323.6 |
| B | 0 | 197 | 199894 | 671.72 | 1611 | 1576 | 295.2 |
| B | 4 | 216 | 86491 | 287.61 | 1611 | 1576 | 295.2 |
| B | 0 | 230 | 40997 | 133.52 | 1611 | 1576 | 295.2 |
| C | 14 | 238 | 243673 | 688.04 | 1543 | 1556 | 351.9 |
| C | 5 | 218 | 127272 | 357.26 | 1543 | 1556 | 351.9 |
| C | 5 | 219 | 55156 | 152.32 | 1543 | 1556 | 351.9 |
| D | 11 | 176 | 7388115 | 20556.56 | 1507 | 1465 | 359.3 |
| D | 13 | 232 | 674304 | 1872.47 | 1507 | 1465 | 359.3 |
| D | 13 | 189 | 263891 | 730.31 | 1507 | 1465 | 359.3 |
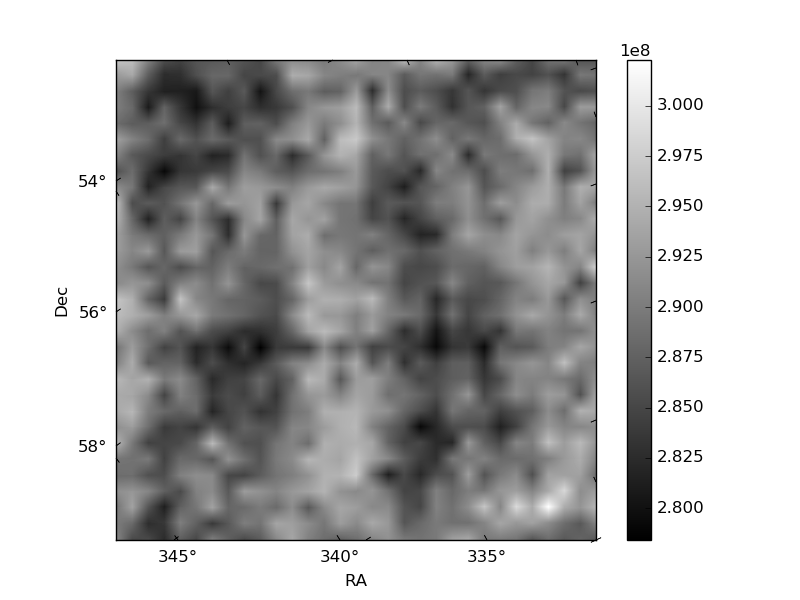
Histogram calculated using DETX and DETY for each event in the final _common_clean file
| Quadrant A |  |
 |
Quadrant B |
|---|---|---|---|
| Quadrant D | 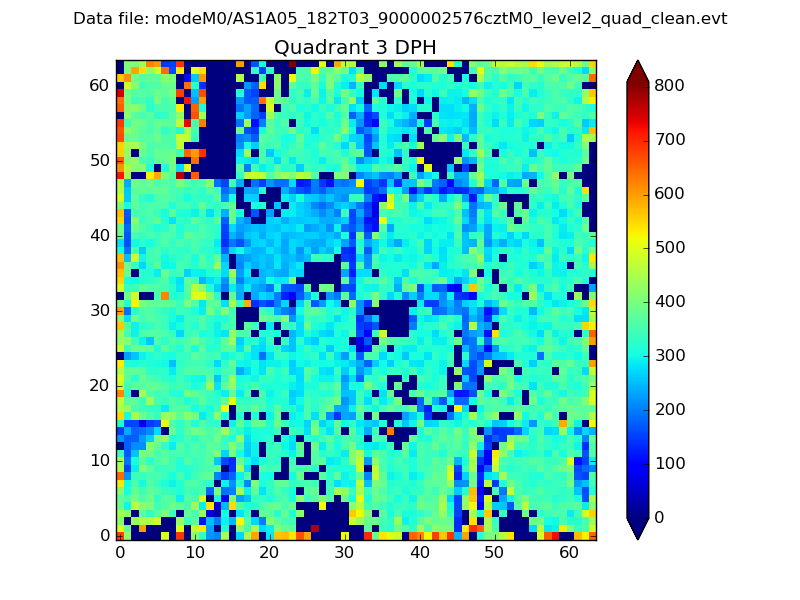 |
 |
Quadrant C |
| Plot type | Count rate plots | Images |
|---|---|---|
| Comparison with Poisson distribution Blue bars denote a histogram of data divided into 1 sec bins. Red curve is a Poisson curve with rate = median count rate of data. |
 |
 |
| Quadrant-wise count rates Data is divided into 100 sec bins |
 |
|
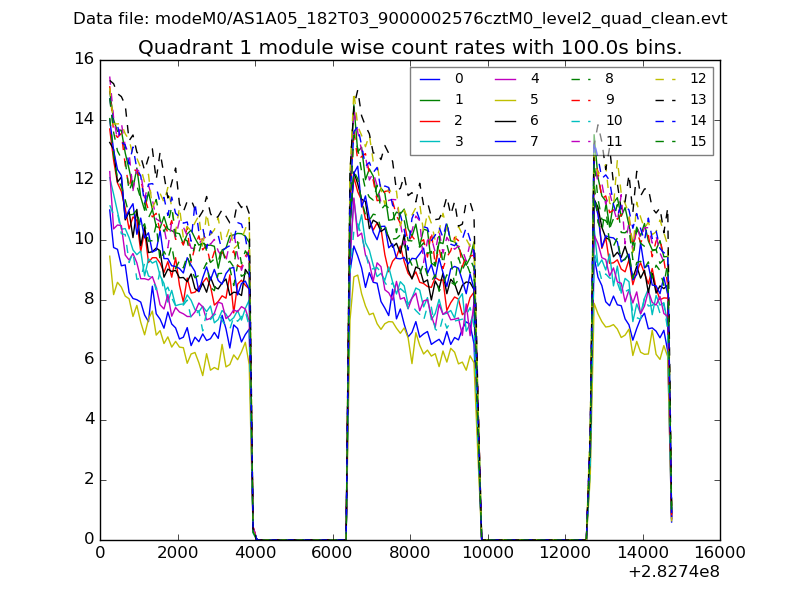
| Module-wise count rates for Quadrant A Data is divided into 100 sec bins |
 |
 |
| Module-wise count rates for Quadrant B Data is divided into 100 sec bins |
 |
 |
| Module-wise count rates for Quadrant C Data is divided into 100 sec bins |
 |
 |
| Module-wise count rates for Quadrant D Data is divided into 100 sec bins |
 |
 |
| Parameter | Plot |
|---|---|
| CZT HV Monitor |  |
| D_VDD | 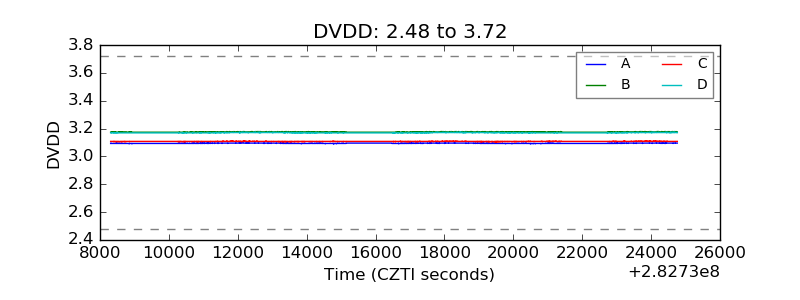 |
| Temperature 1 | 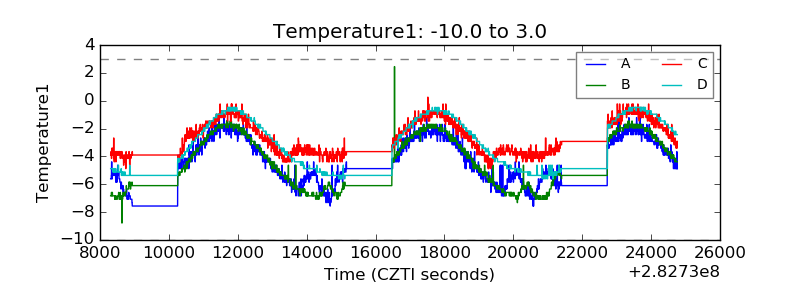 |
| Veto HV Monitor |  |
| Veto LLD |  |
| Alpha Counter | 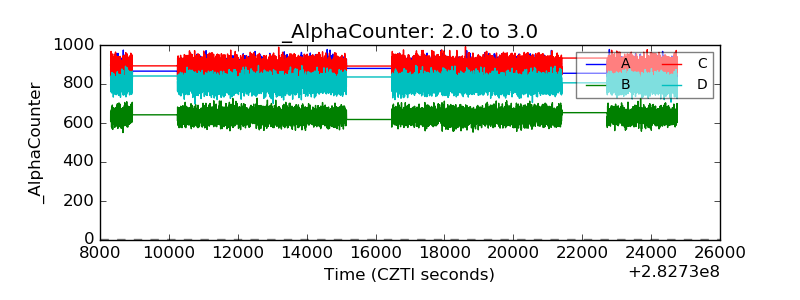 |
| _CPM_Rate |  |
| CZT Counter | 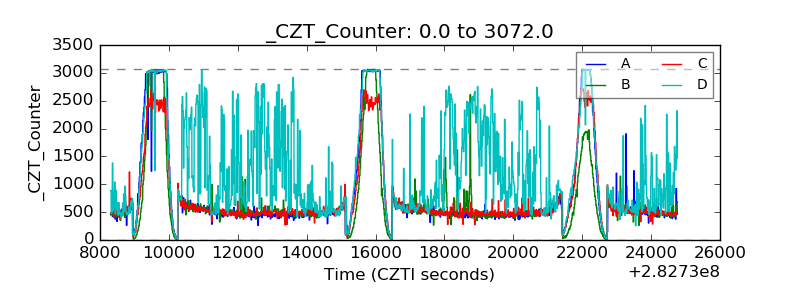 |
| +2.5 Volts monitor |  |
| +5 Volts monitor | 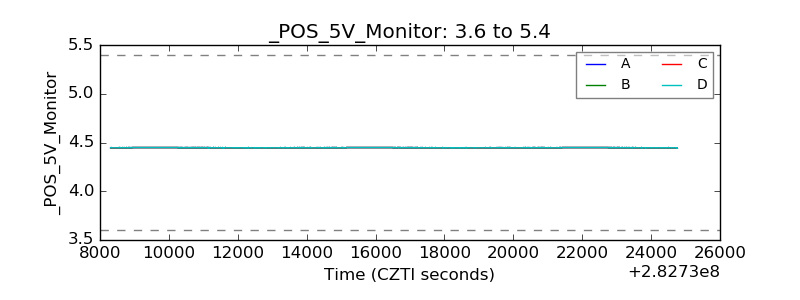 |
| _ROLL_ROT | 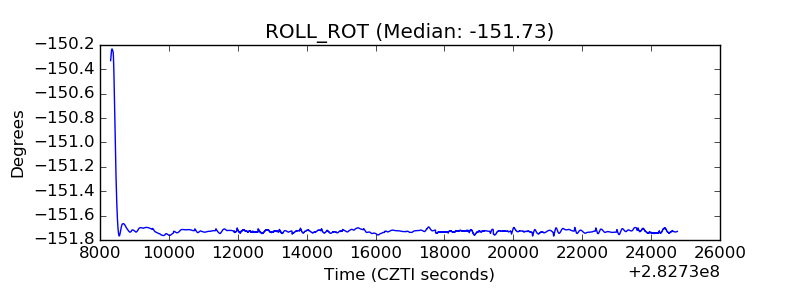 |
| _Roll_DEC |  |
| _Roll_RA | 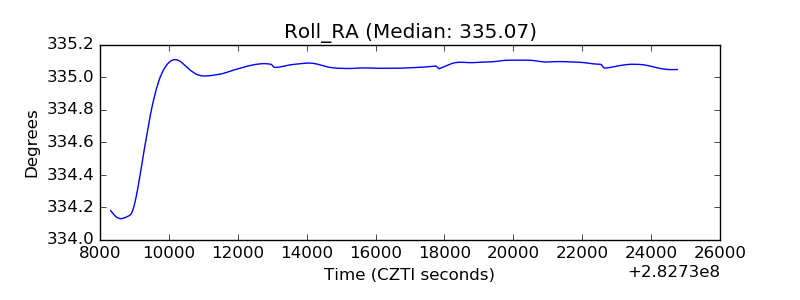 |
| Veto Counter | 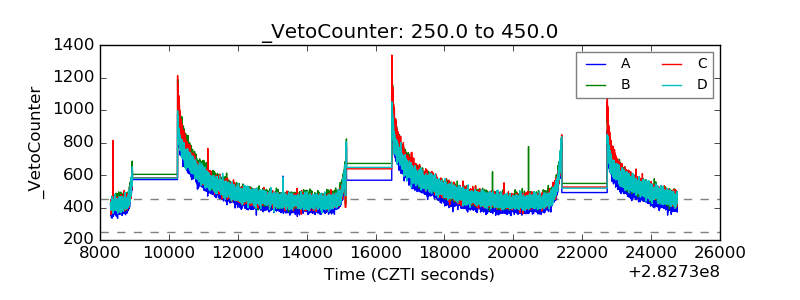 |