| Param | Original file | Final file |
|---|---|---|
| Filename | modeM0/AS1T03_030T01_9000002574cztM0_level2_bc.evt | modeM0/AS1T03_030T01_9000002574cztM0_level2_quad_clean.evt |
| Size (bytes) | 4,886,372,160 | 1,461,159,360 |
| Size | 4.6 GB | 1.4 GB |
| Events in quadrant A | 22,622,878 | 9,561,982 |
| Events in quadrant B | 24,338,747 | 9,597,776 |
| Events in quadrant C | 25,482,469 | 9,118,619 |
| Events in quadrant D | 68,034,499 | 8,414,813 |
| Mode M9 | |||
|---|---|---|---|
| Quadrant | BADHDUFLAG | Total packets | Discarded packets |
| A | 0 | 170 | 0 |
| B | 0 | 170 | 0 |
| C | 0 | 170 | 0 |
| D | 0 | 170 | 0 |
| Mode SS | |||
|---|---|---|---|
| Quadrant | BADHDUFLAG | Total packets | Discarded packets |
| A | 0 | 2170 | 0 |
| B | 0 | 2170 | 0 |
| C | 0 | 2170 | 0 |
| D | 0 | 2170 | 0 |
| Mode M0 | |||
|---|---|---|---|
| Quadrant | BADHDUFLAG | Total packets | Discarded packets |
| A | 0 | 228730 | 0 |
| B | 0 | 235092 | 0 |
| C | 0 | 236012 | 0 |
| D | 0 | 380852 | 0 |
| Quadrant | Total seconds | Saturated seconds | Saturation percentage |
|---|---|---|---|
| A | 110596 | 1036 | 0.936743% |
| B | 110596 | 1573 | 1.422294% |
| C | 110596 | 1484 | 1.341821% |
| D | 110596 | 12286 | 11.108901% |
Noise dominated data is calculated using 1-second bins in cleaned event files. If a bin has >2000 counts, and if more than 50% of those come from <1% of pixels, then it is considered to be noise-dominated and hence unusable.
| Quadrant | # 1 sec bins | Bins with >0 counts | Bins with >2000 counts | High rate bins dominated by noise | Noise dominated (total time) | Noise dominated (detector-on time) | Marked lightcurve |
|---|---|---|---|---|---|---|---|
| A | 127386 | 110594 | 2 | 2 | 0.00% | 0.00% |  |
| B | 127386 | 110593 | 11 | 11 | 0.01% | 0.01% |  |
| C | 127386 | 110596 | 1 | 1 | 0.00% | 0.00% | 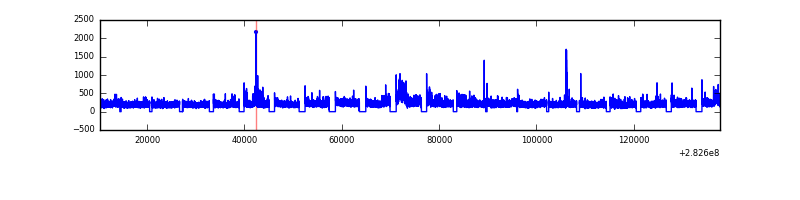 |
| D | 127386 | 110589 | 5216 | 5216 | 4.09% | 4.72% |  |
Top three noisy pixels from each quadrant. If the there are fewer than three noisy pixels in the level2.evt file, extra rows are filled as -1
| Pixel properties | Quadrant properties | ||||||
|---|---|---|---|---|---|---|---|
| Quadrant | DetID | PixID | Counts | Sigma | Mean | Median | Sigma |
| A | 12 | 194 | 38890 | 26.03 | 5881 | 5767 | 1272.6 |
| A | 0 | 226 | 38692 | 25.87 | 5881 | 5767 | 1272.6 |
| A | 4 | 2 | 25139 | 15.22 | 5881 | 5767 | 1272.6 |
| B | 7 | 220 | 374319 | 333.91 | 5898 | 5757 | 1103.8 |
| B | 0 | 197 | 354244 | 315.72 | 5898 | 5757 | 1103.8 |
| B | 0 | 230 | 147940 | 128.81 | 5898 | 5757 | 1103.8 |
| C | 3 | 233 | 2609563 | 2007.04 | 5591 | 5564 | 1297.4 |
| C | 5 | 218 | 1057849 | 811.05 | 5591 | 5564 | 1297.4 |
| C | 14 | 128 | 128477 | 94.74 | 5591 | 5564 | 1297.4 |
| D | 11 | 176 | 28474687 | 22360.2 | 5530 | 5344 | 1273.2 |
| D | 1 | 52 | 8829332 | 6930.48 | 5530 | 5344 | 1273.2 |
| D | 13 | 232 | 5074833 | 3981.64 | 5530 | 5344 | 1273.2 |
Histogram calculated using DETX and DETY for each event in the final _common_clean file
| Quadrant A |  |
 |
Quadrant B |
|---|---|---|---|
| Quadrant D |  |
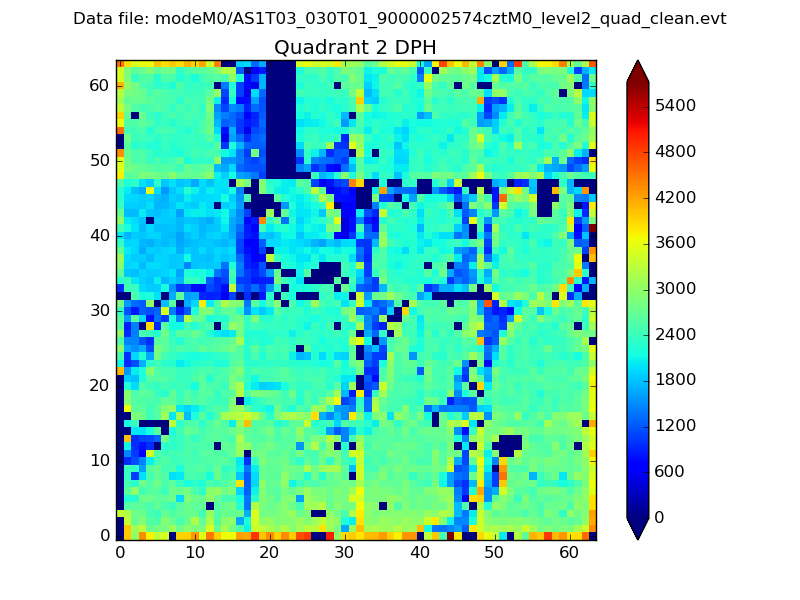 |
Quadrant C |
| Plot type | Count rate plots | Images |
|---|---|---|
| Comparison with Poisson distribution Blue bars denote a histogram of data divided into 1 sec bins. Red curve is a Poisson curve with rate = median count rate of data. |
 |
 |
| Quadrant-wise count rates Data is divided into 100 sec bins |
 |
|
| Module-wise count rates for Quadrant A Data is divided into 100 sec bins |
 |
 |
| Module-wise count rates for Quadrant B Data is divided into 100 sec bins |
 |
 |
| Module-wise count rates for Quadrant C Data is divided into 100 sec bins |
 |
 |
| Module-wise count rates for Quadrant D Data is divided into 100 sec bins |
 |
 |
| Parameter | Plot |
|---|---|
| CZT HV Monitor |  |
| D_VDD |  |
| Temperature 1 |  |
| Veto HV Monitor |  |
| Veto LLD |  |
| Alpha Counter |  |
| _CPM_Rate |  |
| CZT Counter |  |
| +2.5 Volts monitor | 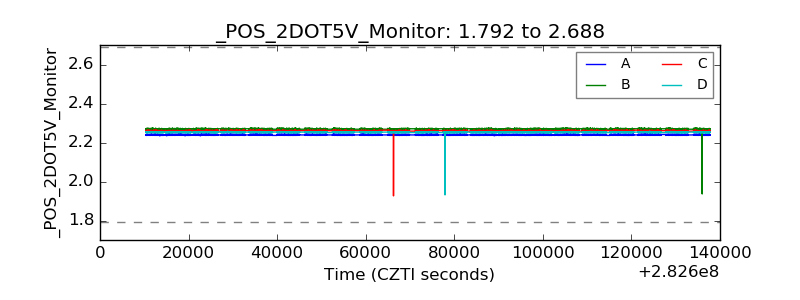 |
| +5 Volts monitor |  |
| _ROLL_ROT |  |
| _Roll_DEC |  |
| _Roll_RA |  |
| Veto Counter |  |