| Param | Original file | Final file |
|---|---|---|
| Filename | modeM0/AS1A05_225T02_9000002570cztM0_level2_bc.evt | modeM0/AS1A05_225T02_9000002570cztM0_level2_quad_clean.evt |
| Size (bytes) | 333,141,120 | 130,106,880 |
| Size | 317.7 MB | 124.1 MB |
| Events in quadrant A | 1,918,684 | 881,608 |
| Events in quadrant B | 1,904,803 | 877,993 |
| Events in quadrant C | 1,779,087 | 829,744 |
| Events in quadrant D | 3,940,740 | 801,176 |
| Mode M9 | |||
|---|---|---|---|
| Quadrant | BADHDUFLAG | Total packets | Discarded packets |
| A | 0 | 20 | 0 |
| B | 0 | 20 | 0 |
| C | 0 | 20 | 0 |
| D | 0 | 20 | 0 |
| Mode SS | |||
|---|---|---|---|
| Quadrant | BADHDUFLAG | Total packets | Discarded packets |
| A | 0 | 160 | 0 |
| B | 0 | 160 | 0 |
| C | 0 | 160 | 0 |
| D | 0 | 160 | 0 |
| Mode M0 | |||
|---|---|---|---|
| Quadrant | BADHDUFLAG | Total packets | Discarded packets |
| A | 0 | 17350 | 0 |
| B | 0 | 17104 | 0 |
| C | 0 | 16877 | 0 |
| D | 0 | 23784 | 0 |
| Quadrant | Total seconds | Saturated seconds | Saturation percentage |
|---|---|---|---|
| A | 7914 | 117 | 1.478393% |
| B | 7914 | 89 | 1.124589% |
| C | 7914 | 97 | 1.225676% |
| D | 7914 | 422 | 5.332322% |
Noise dominated data is calculated using 1-second bins in cleaned event files. If a bin has >2000 counts, and if more than 50% of those come from <1% of pixels, then it is considered to be noise-dominated and hence unusable.
| Quadrant | # 1 sec bins | Bins with >0 counts | Bins with >2000 counts | High rate bins dominated by noise | Noise dominated (total time) | Noise dominated (detector-on time) | Marked lightcurve |
|---|---|---|---|---|---|---|---|
| A | 9188 | 7913 | 0 | 0 | 0.00% | 0.00% |  |
| B | 9188 | 7912 | 1 | 1 | 0.01% | 0.01% |  |
| C | 9188 | 7913 | 0 | 0 | 0.00% | 0.00% |  |
| D | 9188 | 7913 | 184 | 184 | 2.00% | 2.33% |  |
Top three noisy pixels from each quadrant. If the there are fewer than three noisy pixels in the level2.evt file, extra rows are filled as -1
| Pixel properties | Quadrant properties | ||||||
|---|---|---|---|---|---|---|---|
| Quadrant | DetID | PixID | Counts | Sigma | Mean | Median | Sigma |
| A | 9 | 143 | 53726 | 515.18 | 485 | 478 | 103.4 |
| A | 12 | 194 | 3329 | 27.58 | 485 | 478 | 103.4 |
| A | 15 | 191 | 3293 | 27.24 | 485 | 478 | 103.4 |
| B | 4 | 216 | 22918 | 249.23 | 482 | 475 | 90.0 |
| B | 0 | 189 | 12563 | 134.24 | 482 | 475 | 90.0 |
| B | 0 | 214 | 6166 | 63.2 | 482 | 475 | 90.0 |
| C | 3 | 233 | 17168 | 155.81 | 458 | 456 | 107.3 |
| C | 13 | 61 | 2722 | 21.13 | 458 | 456 | 107.3 |
| C | 5 | 218 | 2189 | 16.16 | 458 | 456 | 107.3 |
| D | 11 | 176 | 1689756 | 15803.47 | 465 | 451 | 106.9 |
| D | 13 | 232 | 240460 | 2245.29 | 465 | 451 | 106.9 |
| D | 10 | 70 | 61226 | 568.55 | 465 | 451 | 106.9 |
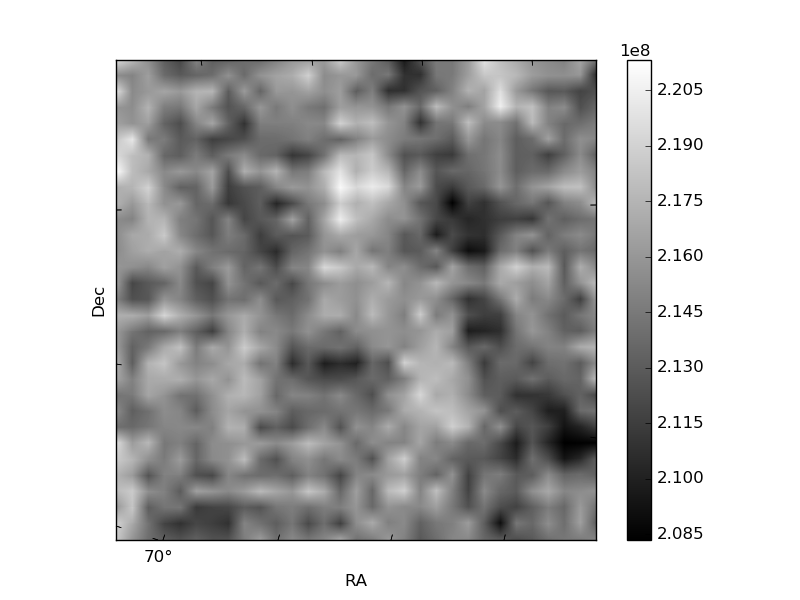
Histogram calculated using DETX and DETY for each event in the final _common_clean file
| Quadrant A |  |
 |
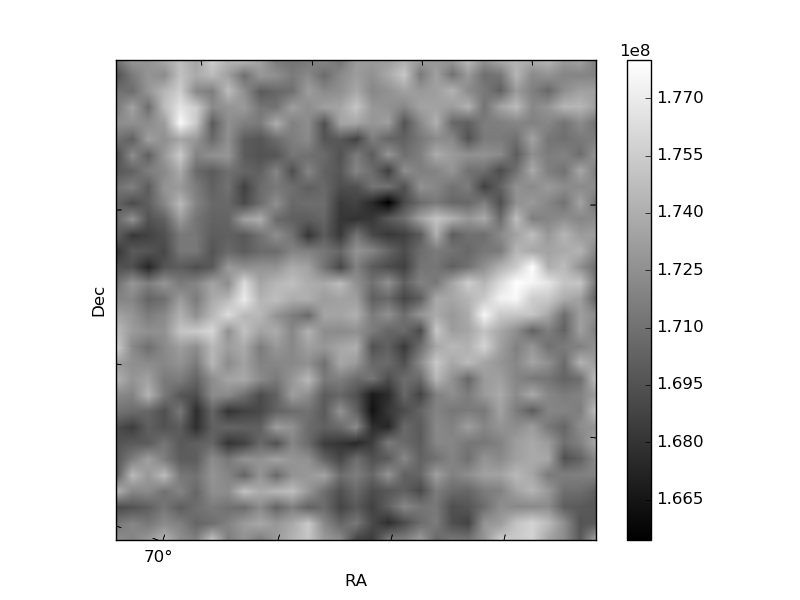
Quadrant B |
|---|---|---|---|
| Quadrant D |  |
 |
Quadrant C |
| Plot type | Count rate plots | Images |
|---|---|---|
| Comparison with Poisson distribution Blue bars denote a histogram of data divided into 1 sec bins. Red curve is a Poisson curve with rate = median count rate of data. |
 |
 |
| Quadrant-wise count rates Data is divided into 100 sec bins |
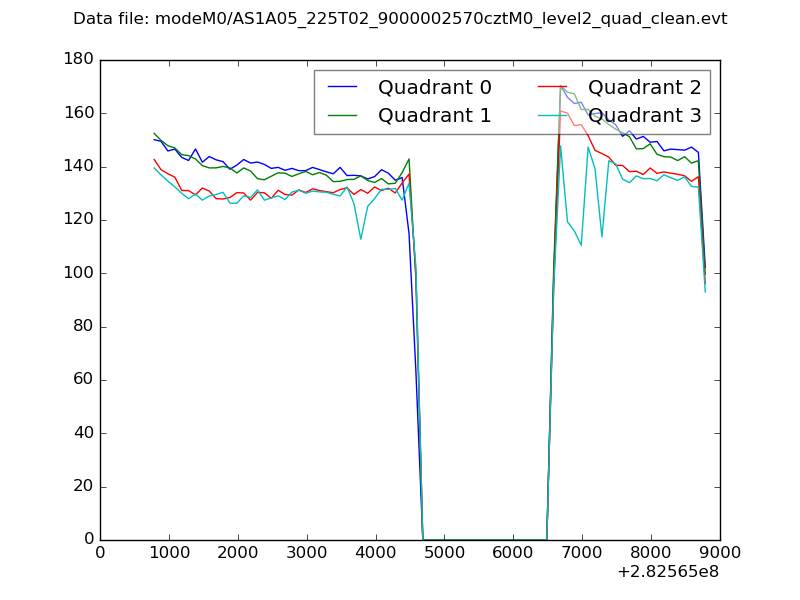 |
|
| Module-wise count rates for Quadrant A Data is divided into 100 sec bins |
 |
 |
| Module-wise count rates for Quadrant B Data is divided into 100 sec bins |
 |
 |
| Module-wise count rates for Quadrant C Data is divided into 100 sec bins |
 |
 |
| Module-wise count rates for Quadrant D Data is divided into 100 sec bins |
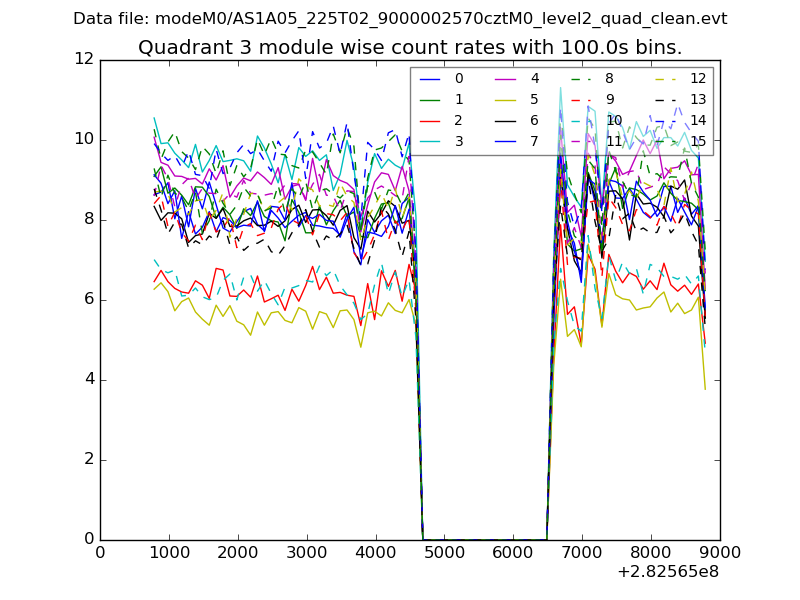 |
 |
| Parameter | Plot |
|---|---|
| CZT HV Monitor | 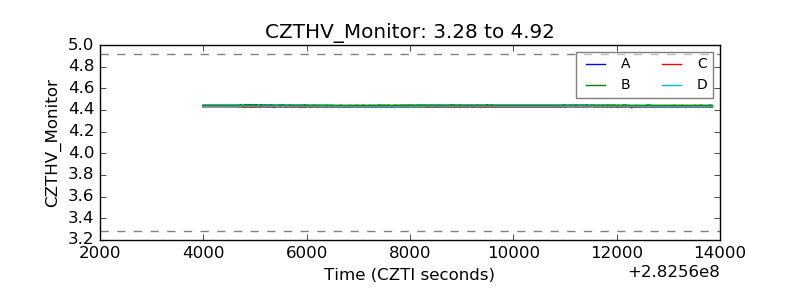 |
| D_VDD |  |
| Temperature 1 |  |
| Veto HV Monitor |  |
| Veto LLD |  |
| Alpha Counter |  |
| _CPM_Rate | 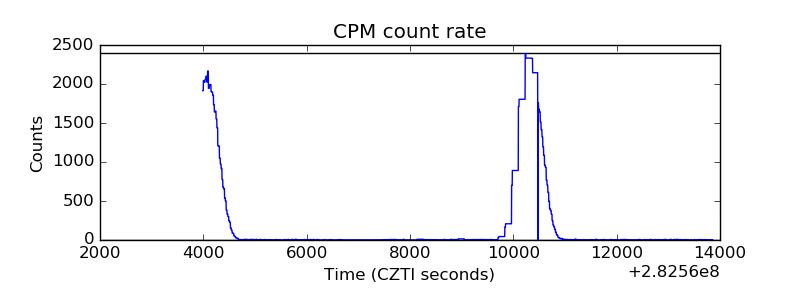 |
| CZT Counter | 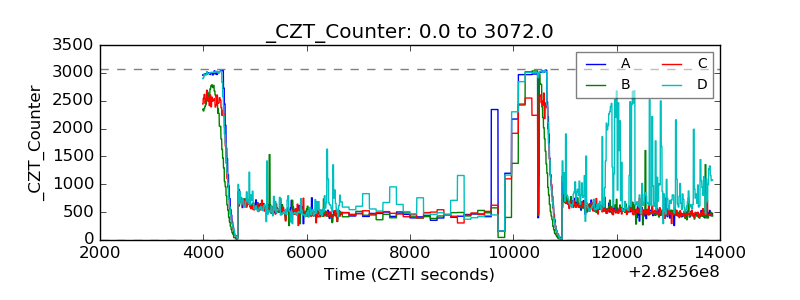 |
| +2.5 Volts monitor |  |
| +5 Volts monitor |  |
| _ROLL_ROT | 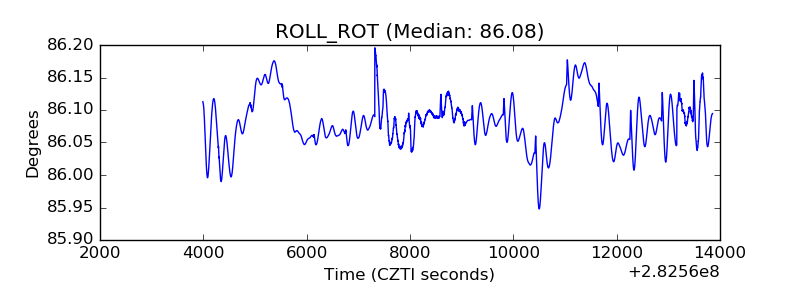 |
| _Roll_DEC | 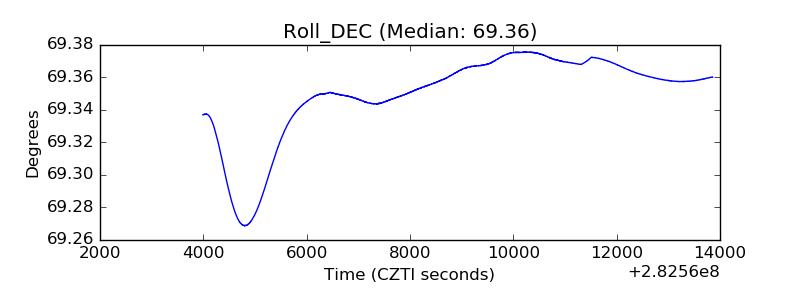 |
| _Roll_RA |  |
| Veto Counter |  |