| Param | Original file | Final file |
|---|---|---|
| Filename | modeM0/AS1A05_074T02_9000002572cztM0_level2_bc.evt | modeM0/AS1A05_074T02_9000002572cztM0_level2_quad_clean.evt |
| Size (bytes) | 1,049,472,000 | 385,231,680 |
| Size | 1000.9 MB | 367.4 MB |
| Events in quadrant A | 6,005,350 | 2,499,234 |
| Events in quadrant B | 6,910,121 | 2,512,179 |
| Events in quadrant C | 5,843,689 | 2,381,575 |
| Events in quadrant D | 11,045,615 | 2,284,633 |
| Mode M9 | |||
|---|---|---|---|
| Quadrant | BADHDUFLAG | Total packets | Discarded packets |
| A | 0 | 55 | 0 |
| B | 0 | 55 | 0 |
| C | 0 | 55 | 0 |
| D | 0 | 55 | 0 |
| Mode M0 | |||
|---|---|---|---|
| Quadrant | BADHDUFLAG | Total packets | Discarded packets |
| A | 0 | 60453 | 0 |
| B | 0 | 64421 | 0 |
| C | 0 | 60421 | 0 |
| D | 0 | 78301 | 0 |
| Mode SS | |||
|---|---|---|---|
| Quadrant | BADHDUFLAG | Total packets | Discarded packets |
| A | 0 | 590 | 0 |
| B | 0 | 590 | 0 |
| C | 0 | 590 | 0 |
| D | 0 | 590 | 0 |
| Quadrant | Total seconds | Saturated seconds | Saturation percentage |
|---|---|---|---|
| A | 28959 | 314 | 1.084292% |
| B | 28959 | 643 | 2.220381% |
| C | 28959 | 439 | 1.515936% |
| D | 28959 | 1365 | 4.713561% |
Noise dominated data is calculated using 1-second bins in cleaned event files. If a bin has >2000 counts, and if more than 50% of those come from <1% of pixels, then it is considered to be noise-dominated and hence unusable.
| Quadrant | # 1 sec bins | Bins with >0 counts | Bins with >2000 counts | High rate bins dominated by noise | Noise dominated (total time) | Noise dominated (detector-on time) | Marked lightcurve |
|---|---|---|---|---|---|---|---|
| A | 34434 | 28958 | 0 | 0 | 0.00% | 0.00% |  |
| B | 34434 | 28959 | 9 | 9 | 0.03% | 0.03% |  |
| C | 34434 | 28959 | 1 | 1 | 0.00% | 0.00% | 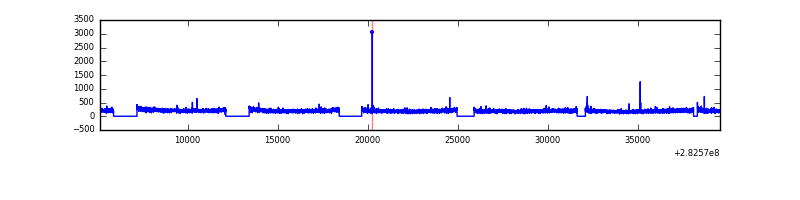 |
| D | 34434 | 28958 | 283 | 283 | 0.82% | 0.98% |  |
Top three noisy pixels from each quadrant. If the there are fewer than three noisy pixels in the level2.evt file, extra rows are filled as -1
| Pixel properties | Quadrant properties | ||||||
|---|---|---|---|---|---|---|---|
| Quadrant | DetID | PixID | Counts | Sigma | Mean | Median | Sigma |
| A | 13 | 210 | 13442 | 35.14 | 1558 | 1529 | 339.0 |
| A | 0 | 226 | 10367 | 26.07 | 1558 | 1529 | 339.0 |
| A | 12 | 194 | 10223 | 25.64 | 1558 | 1529 | 339.0 |
| B | 4 | 216 | 269220 | 909.43 | 1563 | 1526 | 294.4 |
| B | 7 | 220 | 195902 | 660.35 | 1563 | 1526 | 294.4 |
| B | 0 | 197 | 96714 | 323.38 | 1563 | 1526 | 294.4 |
| C | 3 | 233 | 82405 | 237.02 | 1475 | 1464 | 341.5 |
| C | 5 | 218 | 60271 | 172.2 | 1475 | 1464 | 341.5 |
| C | 13 | 61 | 8808 | 21.51 | 1475 | 1464 | 341.5 |
| D | 11 | 176 | 1885234 | 5495.95 | 1486 | 1435 | 342.8 |
| D | 13 | 232 | 1430508 | 4169.29 | 1486 | 1435 | 342.8 |
| D | 13 | 189 | 540384 | 1572.37 | 1486 | 1435 | 342.8 |
Histogram calculated using DETX and DETY for each event in the final _common_clean file
| Quadrant A |  |
 |
Quadrant B |
|---|---|---|---|
| Quadrant D | 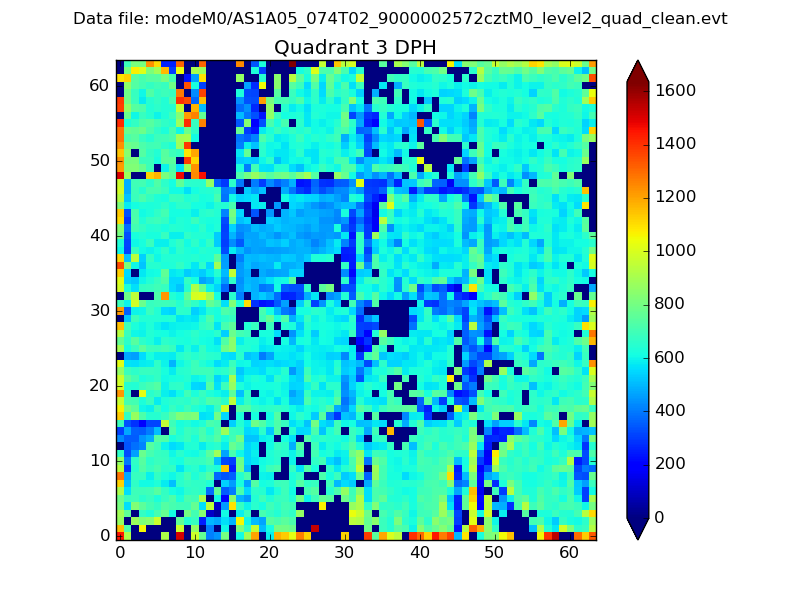 |
 |
Quadrant C |
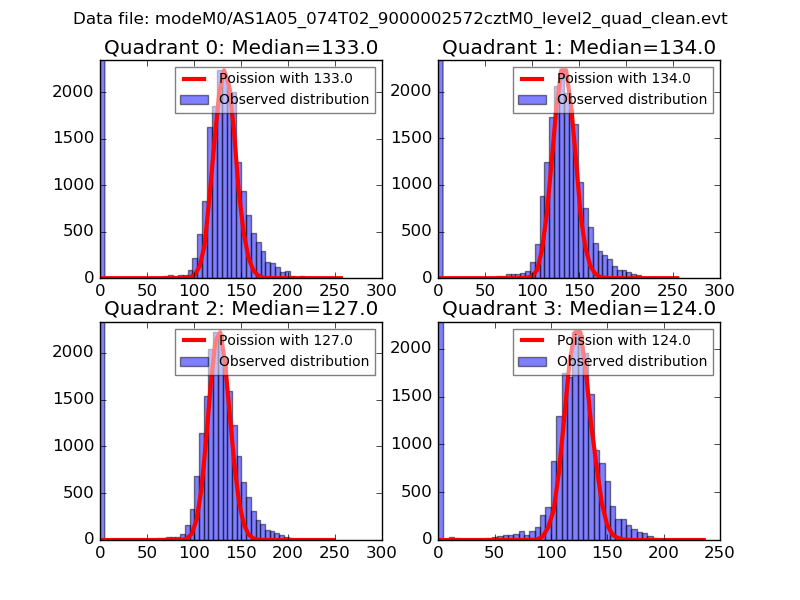
| Plot type | Count rate plots | Images |
|---|---|---|
| Comparison with Poisson distribution Blue bars denote a histogram of data divided into 1 sec bins. Red curve is a Poisson curve with rate = median count rate of data. |
 |
 |
| Quadrant-wise count rates Data is divided into 100 sec bins |
 |
|
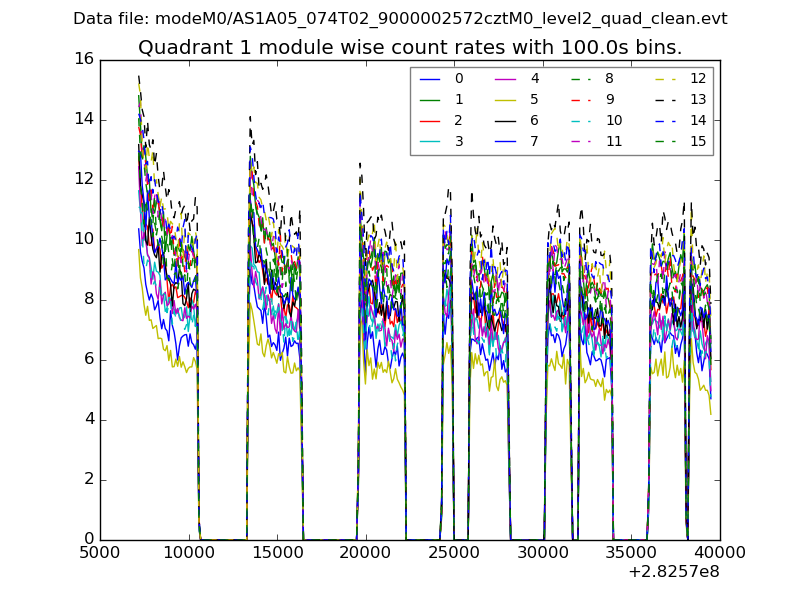
| Module-wise count rates for Quadrant A Data is divided into 100 sec bins |
 |
 |
| Module-wise count rates for Quadrant B Data is divided into 100 sec bins |
 |
 |
| Module-wise count rates for Quadrant C Data is divided into 100 sec bins |
 |
 |
| Module-wise count rates for Quadrant D Data is divided into 100 sec bins |
 |
 |
| Parameter | Plot |
|---|---|
| CZT HV Monitor |  |
| D_VDD |  |
| Temperature 1 |  |
| Veto HV Monitor |  |
| Veto LLD |  |
| Alpha Counter |  |
| _CPM_Rate |  |
| CZT Counter | 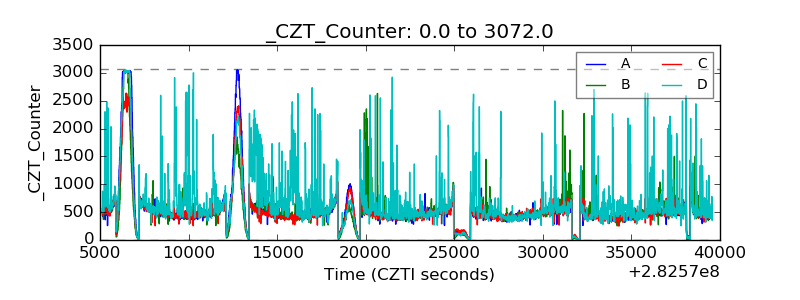 |
| +2.5 Volts monitor |  |
| +5 Volts monitor |  |
| _ROLL_ROT | 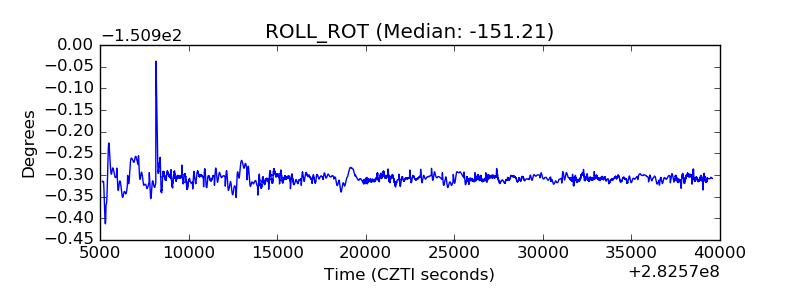 |
| _Roll_DEC |  |
| _Roll_RA |  |
| Veto Counter |  |