| Param | Original file | Final file |
|---|---|---|
| Filename | modeM0/AS1T03_033T01_9000002568cztM0_level2_bc.evt | modeM0/AS1T03_033T01_9000002568cztM0_level2_quad_clean.evt |
| Size (bytes) | 2,015,066,880 | 507,196,800 |
| Size | 1.9 GB | 483.7 MB |
| Events in quadrant A | 8,586,424 | 3,186,770 |
| Events in quadrant B | 8,820,649 | 3,242,927 |
| Events in quadrant C | 8,426,700 | 3,112,405 |
| Events in quadrant D | 32,252,884 | 2,858,047 |
| Mode SS | |||
|---|---|---|---|
| Quadrant | BADHDUFLAG | Total packets | Discarded packets |
| A | 0 | 878 | 0 |
| B | 0 | 878 | 0 |
| C | 0 | 878 | 0 |
| D | 0 | 878 | 0 |
| Mode M9 | |||
|---|---|---|---|
| Quadrant | BADHDUFLAG | Total packets | Discarded packets |
| A | 0 | 42 | 0 |
| B | 0 | 42 | 0 |
| C | 0 | 42 | 0 |
| D | 0 | 42 | 0 |
| Mode M0 | |||
|---|---|---|---|
| Quadrant | BADHDUFLAG | Total packets | Discarded packets |
| A | 0 | 88926 | 0 |
| B | 0 | 89816 | 0 |
| C | 0 | 88796 | 0 |
| D | 0 | 169475 | 0 |
| Quadrant | Total seconds | Saturated seconds | Saturation percentage |
|---|---|---|---|
| A | 43135 | 318 | 0.737220% |
| B | 43135 | 500 | 1.159152% |
| C | 43135 | 563 | 1.305205% |
| D | 43135 | 7593 | 17.602875% |
Noise dominated data is calculated using 1-second bins in cleaned event files. If a bin has >2000 counts, and if more than 50% of those come from <1% of pixels, then it is considered to be noise-dominated and hence unusable.
| Quadrant | # 1 sec bins | Bins with >0 counts | Bins with >2000 counts | High rate bins dominated by noise | Noise dominated (total time) | Noise dominated (detector-on time) | Marked lightcurve |
|---|---|---|---|---|---|---|---|
| A | 47245 | 43133 | 0 | 0 | 0.00% | 0.00% | 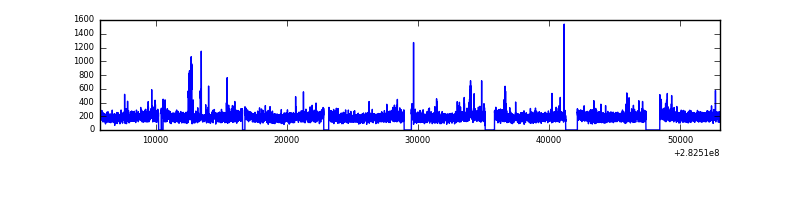 |
| B | 47245 | 43133 | 3 | 3 | 0.01% | 0.01% | 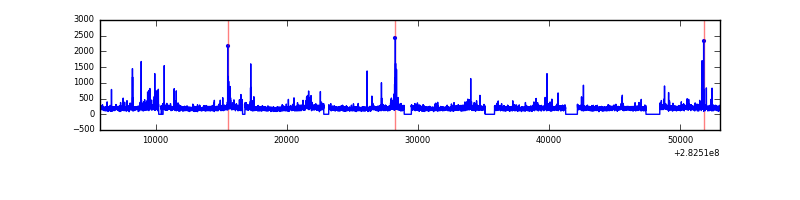 |
| C | 47245 | 43133 | 0 | 0 | 0.00% | 0.00% | 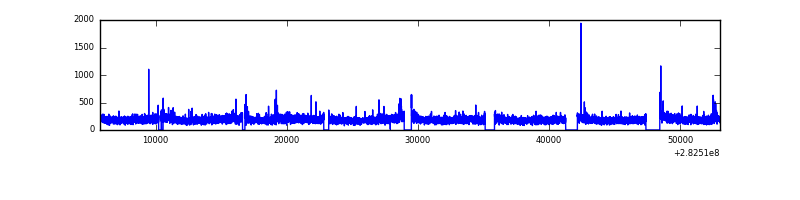 |
| D | 47245 | 43134 | 2728 | 2728 | 5.77% | 6.32% |  |
Top three noisy pixels from each quadrant. If the there are fewer than three noisy pixels in the level2.evt file, extra rows are filled as -1
| Pixel properties | Quadrant properties | ||||||
|---|---|---|---|---|---|---|---|
| Quadrant | DetID | PixID | Counts | Sigma | Mean | Median | Sigma |
| A | 0 | 23 | 146288 | 300.72 | 2181 | 2134 | 479.4 |
| A | 13 | 210 | 38931 | 76.76 | 2181 | 2134 | 479.4 |
| A | 9 | 143 | 22285 | 42.04 | 2181 | 2134 | 479.4 |
| B | 4 | 216 | 131498 | 307.16 | 2199 | 2139 | 421.1 |
| B | 0 | 182 | 53088 | 120.98 | 2199 | 2139 | 421.1 |
| B | 0 | 189 | 43859 | 99.06 | 2199 | 2139 | 421.1 |
| C | 3 | 233 | 262777 | 533.16 | 2100 | 2086 | 489.0 |
| C | 9 | 54 | 55301 | 108.83 | 2100 | 2086 | 489.0 |
| C | 8 | 128 | 13109 | 22.54 | 2100 | 2086 | 489.0 |
| D | 11 | 176 | 17437369 | 37306.81 | 1974 | 1899 | 467.4 |
| D | 1 | 52 | 2579757 | 5515.86 | 1974 | 1899 | 467.4 |
| D | 13 | 232 | 1919263 | 4102.6 | 1974 | 1899 | 467.4 |
Histogram calculated using DETX and DETY for each event in the final _common_clean file
| Quadrant A |  |
 |
Quadrant B |
|---|---|---|---|
| Quadrant D |  |
 |
Quadrant C |
| Plot type | Count rate plots | Images |
|---|---|---|
| Comparison with Poisson distribution Blue bars denote a histogram of data divided into 1 sec bins. Red curve is a Poisson curve with rate = median count rate of data. |
 |
 |
| Quadrant-wise count rates Data is divided into 100 sec bins |
 |
|
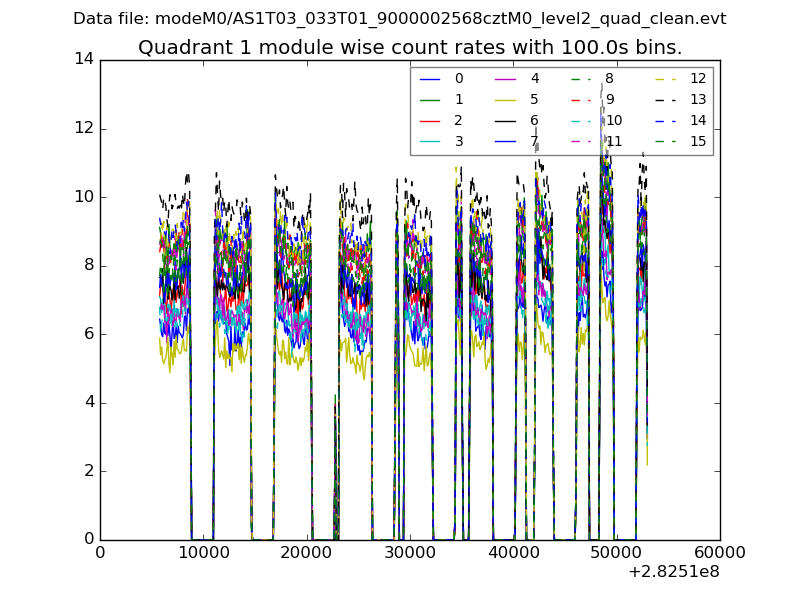
| Module-wise count rates for Quadrant A Data is divided into 100 sec bins |
 |
 |
| Module-wise count rates for Quadrant B Data is divided into 100 sec bins |
 |
 |
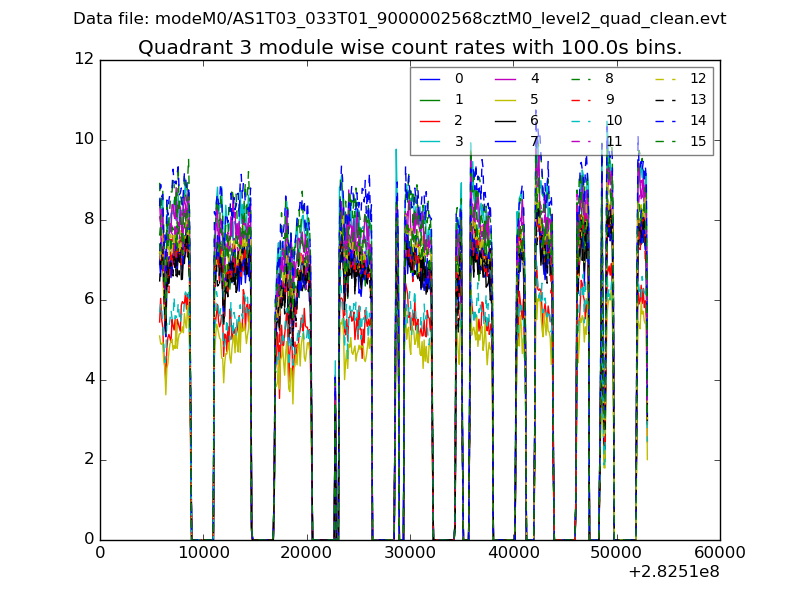
| Module-wise count rates for Quadrant C Data is divided into 100 sec bins |
 |
 |
| Module-wise count rates for Quadrant D Data is divided into 100 sec bins |
 |
 |
| Parameter | Plot |
|---|---|
| CZT HV Monitor |  |
| D_VDD |  |
| Temperature 1 |  |
| Veto HV Monitor |  |
| Veto LLD |  |
| Alpha Counter |  |
| _CPM_Rate |  |
| CZT Counter | 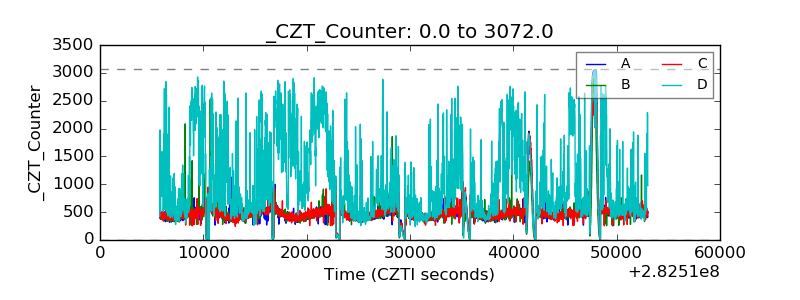 |
| +2.5 Volts monitor |  |
| +5 Volts monitor | 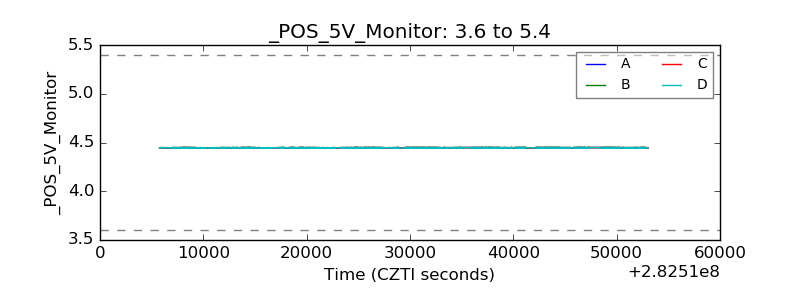 |
| _ROLL_ROT |  |
| _Roll_DEC |  |
| _Roll_RA |  |
| Veto Counter | 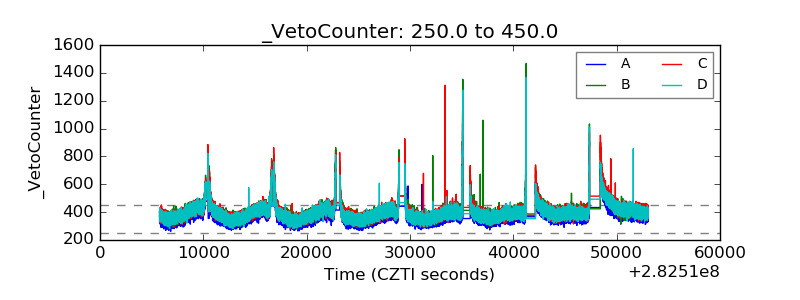 |