| Param | Original file | Final file |
|---|---|---|
| Filename | modeM0/AS1A05_165T12_9000002562cztM0_level2_bc.evt | modeM0/AS1A05_165T12_9000002562cztM0_level2_quad_clean.evt |
| Size (bytes) | 3,325,409,280 | 1,310,045,760 |
| Size | 3.1 GB | 1.2 GB |
| Events in quadrant A | 20,463,555 | 8,392,686 |
| Events in quadrant B | 21,061,298 | 8,507,146 |
| Events in quadrant C | 20,056,286 | 8,020,740 |
| Events in quadrant D | 32,211,844 | 7,803,896 |
| Mode M9 | |||
|---|---|---|---|
| Quadrant | BADHDUFLAG | Total packets | Discarded packets |
| A | 0 | 149 | 0 |
| B | 0 | 149 | 0 |
| C | 0 | 149 | 0 |
| D | 0 | 149 | 0 |
| Mode SS | |||
|---|---|---|---|
| Quadrant | BADHDUFLAG | Total packets | Discarded packets |
| A | 0 | 2064 | 0 |
| B | 0 | 2064 | 0 |
| C | 0 | 2064 | 0 |
| D | 0 | 2064 | 0 |
| Mode M0 | |||
|---|---|---|---|
| Quadrant | BADHDUFLAG | Total packets | Discarded packets |
| A | 0 | 209093 | 0 |
| B | 0 | 210782 | 0 |
| C | 0 | 209578 | 0 |
| D | 0 | 251277 | 0 |
| Quadrant | Total seconds | Saturated seconds | Saturation percentage |
|---|---|---|---|
| A | 101508 | 797 | 0.785160% |
| B | 101508 | 999 | 0.984159% |
| C | 101508 | 1287 | 1.267880% |
| D | 101508 | 2582 | 2.543642% |
Noise dominated data is calculated using 1-second bins in cleaned event files. If a bin has >2000 counts, and if more than 50% of those come from <1% of pixels, then it is considered to be noise-dominated and hence unusable.
| Quadrant | # 1 sec bins | Bins with >0 counts | Bins with >2000 counts | High rate bins dominated by noise | Noise dominated (total time) | Noise dominated (detector-on time) | Marked lightcurve |
|---|---|---|---|---|---|---|---|
| A | 116318 | 101508 | 1 | 1 | 0.00% | 0.00% |  |
| B | 116318 | 101507 | 2 | 2 | 0.00% | 0.00% |  |
| C | 116318 | 101508 | 0 | 0 | 0.00% | 0.00% |  |
| D | 116318 | 101507 | 260 | 260 | 0.22% | 0.26% |  |
Top three noisy pixels from each quadrant. If the there are fewer than three noisy pixels in the level2.evt file, extra rows are filled as -1
| Pixel properties | Quadrant properties | ||||||
|---|---|---|---|---|---|---|---|
| Quadrant | DetID | PixID | Counts | Sigma | Mean | Median | Sigma |
| A | 15 | 191 | 38117 | 28.46 | 5320 | 5219 | 1156.0 |
| A | 0 | 226 | 35561 | 26.25 | 5320 | 5219 | 1156.0 |
| A | 12 | 194 | 33786 | 24.71 | 5320 | 5219 | 1156.0 |
| B | 4 | 216 | 154820 | 149.79 | 5368 | 5236 | 998.6 |
| B | 0 | 229 | 121288 | 116.21 | 5368 | 5236 | 998.6 |
| B | 4 | 173 | 82408 | 77.28 | 5368 | 5236 | 998.6 |
| C | 3 | 233 | 387027 | 324.42 | 5091 | 5064 | 1177.4 |
| C | 8 | 128 | 30986 | 22.02 | 5091 | 5064 | 1177.4 |
| C | 13 | 61 | 29848 | 21.05 | 5091 | 5064 | 1177.4 |
| D | 5 | 222 | 4501875 | 3781.74 | 5153 | 4972 | 1189.1 |
| D | 13 | 232 | 2604350 | 2185.99 | 5153 | 4972 | 1189.1 |
| D | 13 | 189 | 1562676 | 1309.97 | 5153 | 4972 | 1189.1 |
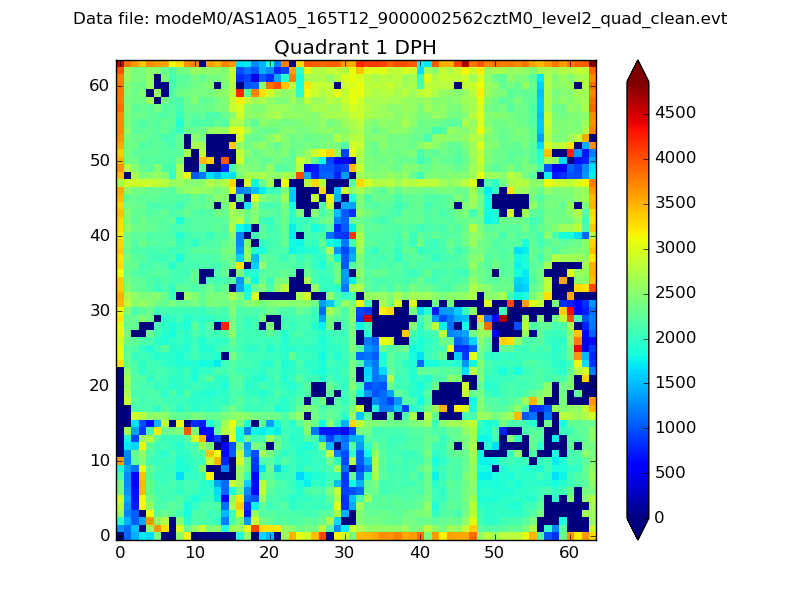
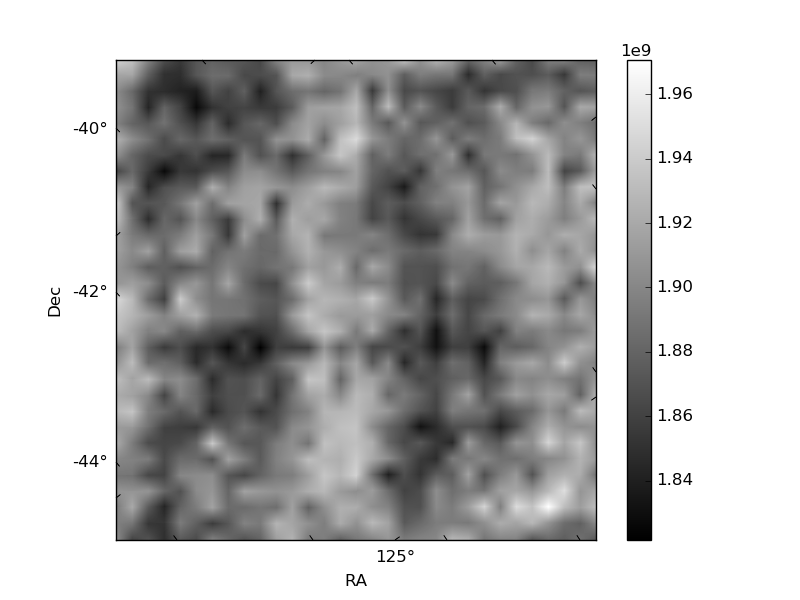
Histogram calculated using DETX and DETY for each event in the final _common_clean file
| Quadrant A |  |
 |
Quadrant B |
|---|---|---|---|
| Quadrant D |  |
 |
Quadrant C |
| Plot type | Count rate plots | Images |
|---|---|---|
| Comparison with Poisson distribution Blue bars denote a histogram of data divided into 1 sec bins. Red curve is a Poisson curve with rate = median count rate of data. |
 |
 |
| Quadrant-wise count rates Data is divided into 100 sec bins |
 |
|
| Module-wise count rates for Quadrant A Data is divided into 100 sec bins |
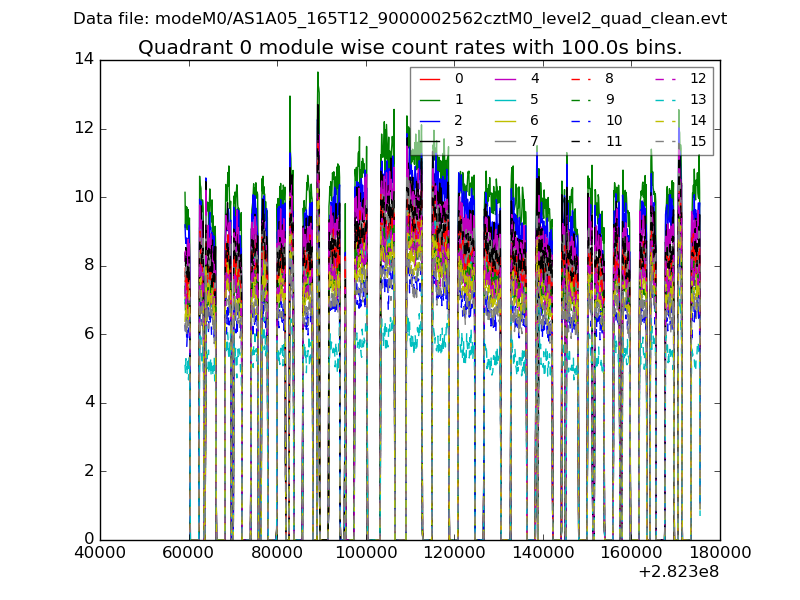 |
 |
| Module-wise count rates for Quadrant B Data is divided into 100 sec bins |
 |
 |
| Module-wise count rates for Quadrant C Data is divided into 100 sec bins |
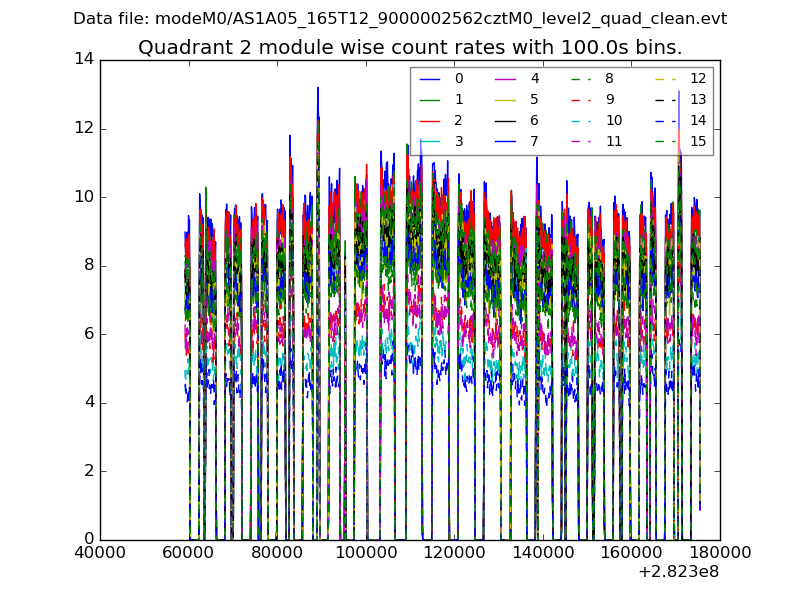 |
 |
| Module-wise count rates for Quadrant D Data is divided into 100 sec bins |
 |
 |
| Parameter | Plot |
|---|---|
| CZT HV Monitor |  |
| D_VDD | 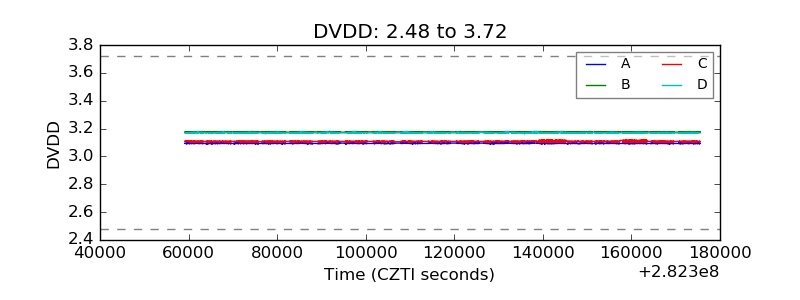 |
| Temperature 1 |  |
| Veto HV Monitor | 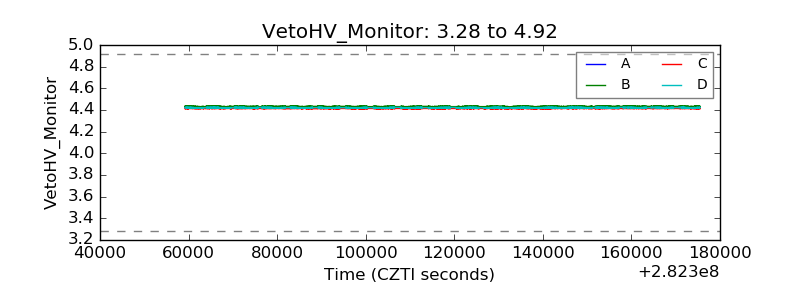 |
| Veto LLD |  |
| Alpha Counter |  |
| _CPM_Rate |  |
| CZT Counter | 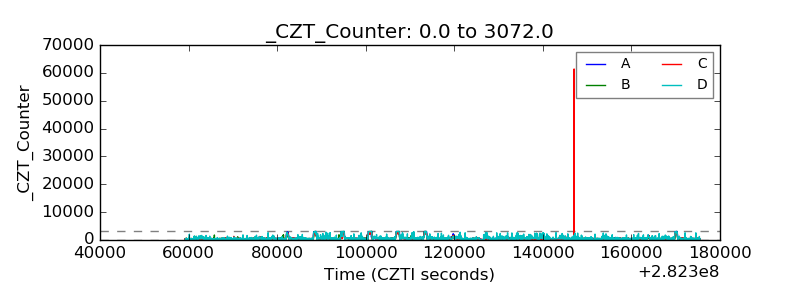 |
| +2.5 Volts monitor |  |
| +5 Volts monitor | 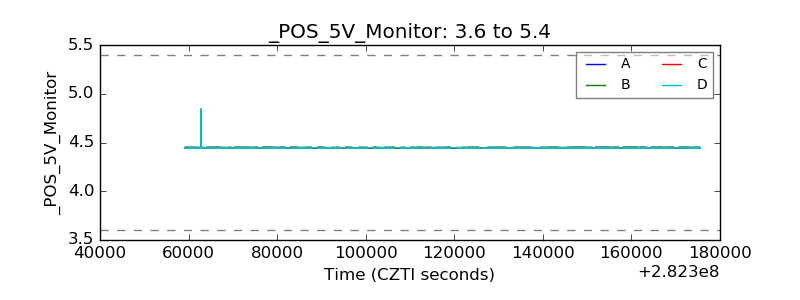 |
| _ROLL_ROT |  |
| _Roll_DEC |  |
| _Roll_RA | 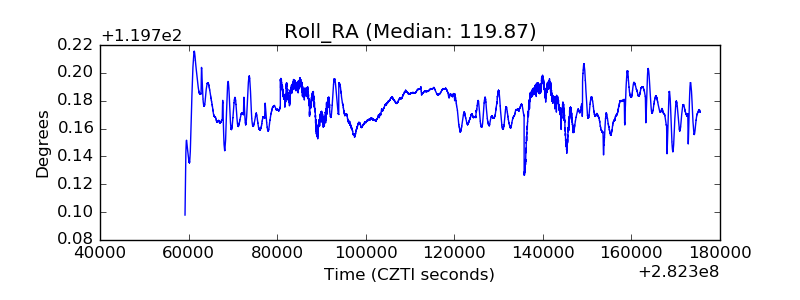 |
| Veto Counter | 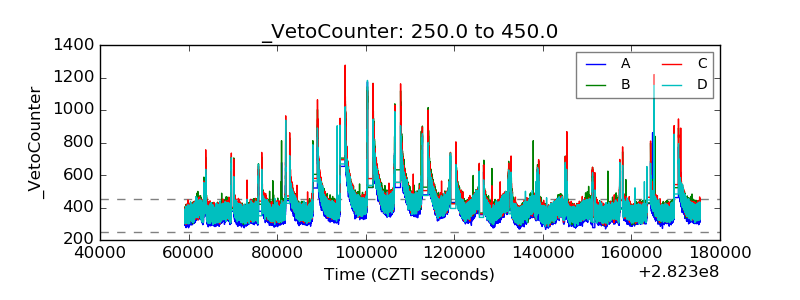 |