| Param | Original file | Final file |
|---|---|---|
| Filename | modeM0/AS1A05_025T16_9000002560cztM0_level2_bc.evt | modeM0/AS1A05_025T16_9000002560cztM0_level2_quad_clean.evt |
| Size (bytes) | 664,505,280 | 278,444,160 |
| Size | 633.7 MB | 265.5 MB |
| Events in quadrant A | 4,148,822 | 1,794,447 |
| Events in quadrant B | 4,308,434 | 1,814,900 |
| Events in quadrant C | 4,434,008 | 1,701,348 |
| Events in quadrant D | 5,786,765 | 1,668,793 |
| Mode SS | |||
|---|---|---|---|
| Quadrant | BADHDUFLAG | Total packets | Discarded packets |
| A | 0 | 432 | 0 |
| B | 0 | 432 | 0 |
| C | 0 | 432 | 0 |
| D | 0 | 432 | 0 |
| Mode M0 | |||
|---|---|---|---|
| Quadrant | BADHDUFLAG | Total packets | Discarded packets |
| A | 0 | 43307 | 0 |
| B | 0 | 43792 | 0 |
| C | 0 | 44761 | 0 |
| D | 0 | 49240 | 0 |
| Mode M9 | |||
|---|---|---|---|
| Quadrant | BADHDUFLAG | Total packets | Discarded packets |
| A | 0 | 24 | 0 |
| B | 0 | 24 | 0 |
| C | 0 | 24 | 0 |
| D | 0 | 24 | 0 |
| Quadrant | Total seconds | Saturated seconds | Saturation percentage |
|---|---|---|---|
| A | 21116 | 72 | 0.340974% |
| B | 21116 | 170 | 0.805077% |
| C | 21116 | 346 | 1.638568% |
| D | 21116 | 374 | 1.771169% |
Noise dominated data is calculated using 1-second bins in cleaned event files. If a bin has >2000 counts, and if more than 50% of those come from <1% of pixels, then it is considered to be noise-dominated and hence unusable.
| Quadrant | # 1 sec bins | Bins with >0 counts | Bins with >2000 counts | High rate bins dominated by noise | Noise dominated (total time) | Noise dominated (detector-on time) | Marked lightcurve |
|---|---|---|---|---|---|---|---|
| A | 23601 | 21117 | 0 | 0 | 0.00% | 0.00% | 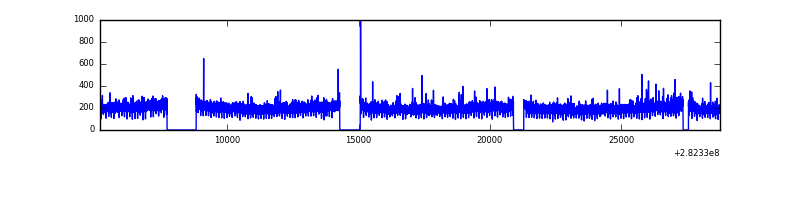 |
| B | 23601 | 21117 | 0 | 0 | 0.00% | 0.00% |  |
| C | 23601 | 21116 | 1 | 1 | 0.00% | 0.00% |  |
| D | 23601 | 21116 | 41 | 41 | 0.17% | 0.19% |  |
Top three noisy pixels from each quadrant. If the there are fewer than three noisy pixels in the level2.evt file, extra rows are filled as -1
| Pixel properties | Quadrant properties | ||||||
|---|---|---|---|---|---|---|---|
| Quadrant | DetID | PixID | Counts | Sigma | Mean | Median | Sigma |
| A | 10 | 1 | 7948 | 28.91 | 1077 | 1053 | 238.5 |
| A | 15 | 191 | 7933 | 28.84 | 1077 | 1053 | 238.5 |
| A | 0 | 226 | 6918 | 24.59 | 1077 | 1053 | 238.5 |
| B | 0 | 230 | 36398 | 167.96 | 1088 | 1057 | 210.4 |
| B | 4 | 173 | 29345 | 134.44 | 1088 | 1057 | 210.4 |
| B | 0 | 214 | 28753 | 131.63 | 1088 | 1057 | 210.4 |
| C | 3 | 233 | 443199 | 1830.14 | 1027 | 1017 | 241.6 |
| C | 8 | 128 | 13339 | 51.0 | 1027 | 1017 | 241.6 |
| C | 1 | 16 | 9311 | 34.33 | 1027 | 1017 | 241.6 |
| D | 5 | 222 | 618286 | 2558.53 | 1039 | 1002 | 241.3 |
| D | 13 | 189 | 271440 | 1120.91 | 1039 | 1002 | 241.3 |
| D | 10 | 70 | 268827 | 1110.08 | 1039 | 1002 | 241.3 |
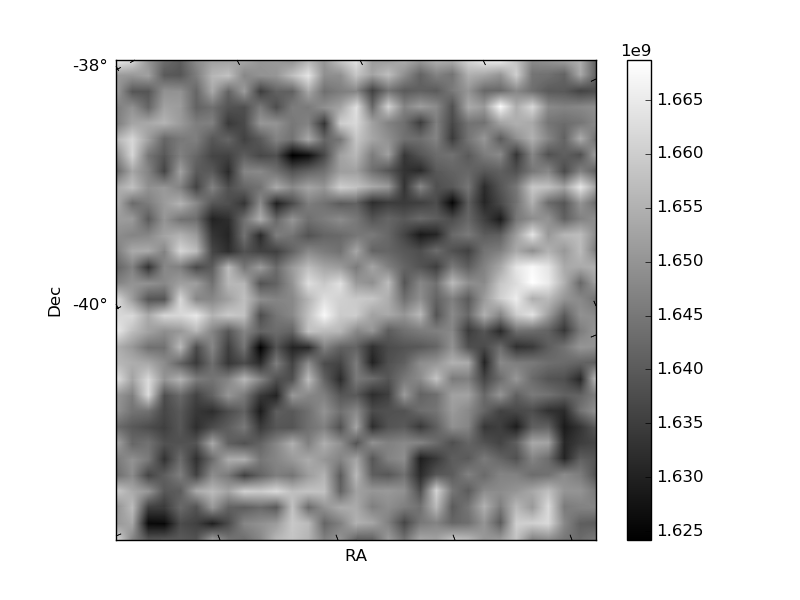
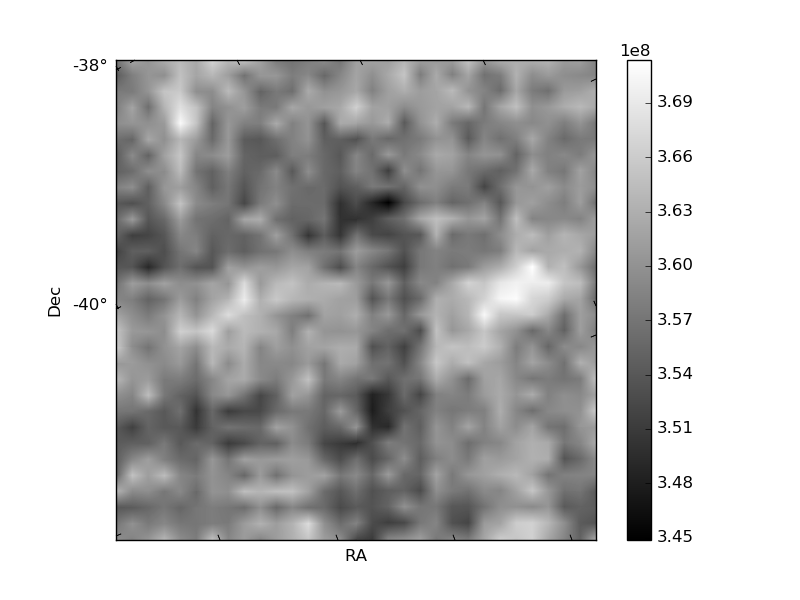
Histogram calculated using DETX and DETY for each event in the final _common_clean file
| Quadrant A |  |
 |
Quadrant B |
|---|---|---|---|
| Quadrant D |  |
 |
Quadrant C |
| Plot type | Count rate plots | Images |
|---|---|---|
| Comparison with Poisson distribution Blue bars denote a histogram of data divided into 1 sec bins. Red curve is a Poisson curve with rate = median count rate of data. |
 |
 |
| Quadrant-wise count rates Data is divided into 100 sec bins |
 |
|
| Module-wise count rates for Quadrant A Data is divided into 100 sec bins |
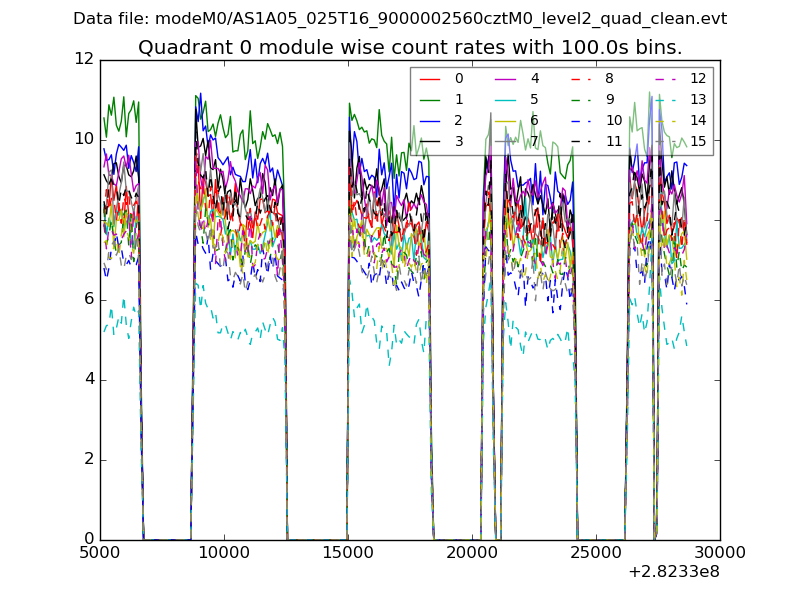 |
 |
| Module-wise count rates for Quadrant B Data is divided into 100 sec bins |
 |
 |
| Module-wise count rates for Quadrant C Data is divided into 100 sec bins |
 |
 |
| Module-wise count rates for Quadrant D Data is divided into 100 sec bins |
 |
 |
| Parameter | Plot |
|---|---|
| CZT HV Monitor |  |
| D_VDD |  |
| Temperature 1 |  |
| Veto HV Monitor | 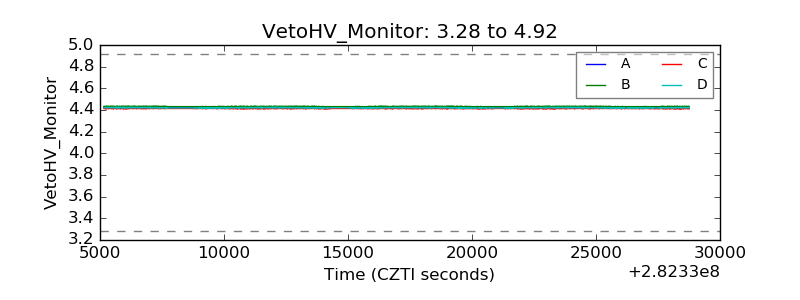 |
| Veto LLD |  |
| Alpha Counter |  |
| _CPM_Rate |  |
| CZT Counter |  |
| +2.5 Volts monitor | 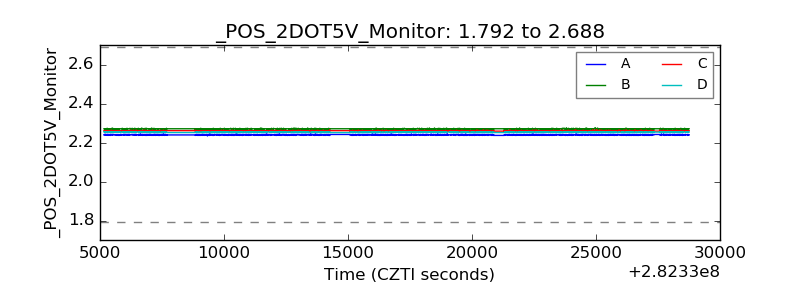 |
| +5 Volts monitor |  |
| _ROLL_ROT | 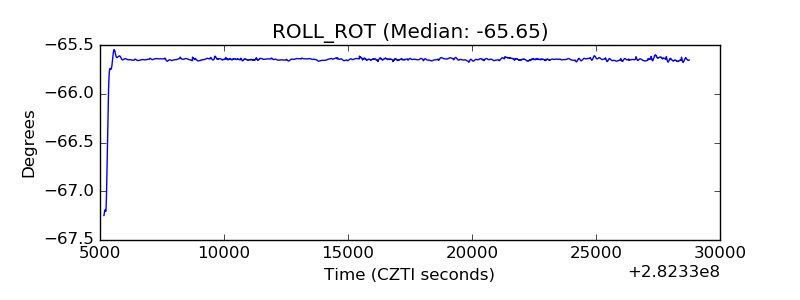 |
| _Roll_DEC |  |
| _Roll_RA | 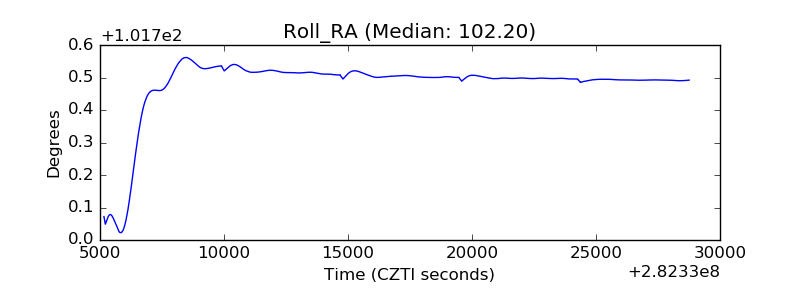 |
| Veto Counter |  |