| Param | Original file | Final file |
|---|---|---|
| Filename | modeM0/AS1A05_169T01_9000002558cztM0_level2_bc.evt | modeM0/AS1A05_169T01_9000002558cztM0_level2_quad_clean.evt |
| Size (bytes) | 3,072,320,640 | 1,331,340,480 |
| Size | 2.9 GB | 1.2 GB |
| Events in quadrant A | 20,368,516 | 8,656,259 |
| Events in quadrant B | 20,930,424 | 8,706,449 |
| Events in quadrant C | 20,212,758 | 8,171,090 |
| Events in quadrant D | 24,875,030 | 8,099,033 |
| Mode SS | |||
|---|---|---|---|
| Quadrant | BADHDUFLAG | Total packets | Discarded packets |
| A | 0 | 1990 | 0 |
| B | 0 | 1990 | 0 |
| C | 0 | 1990 | 0 |
| D | 0 | 1990 | 0 |
| Mode M0 | |||
|---|---|---|---|
| Quadrant | BADHDUFLAG | Total packets | Discarded packets |
| A | 0 | 203908 | 0 |
| B | 0 | 206069 | 0 |
| C | 0 | 206473 | 0 |
| D | 0 | 218515 | 0 |
| Mode M9 | |||
|---|---|---|---|
| Quadrant | BADHDUFLAG | Total packets | Discarded packets |
| A | 0 | 180 | 0 |
| B | 0 | 180 | 0 |
| C | 0 | 180 | 0 |
| D | 0 | 180 | 0 |
| Quadrant | Total seconds | Saturated seconds | Saturation percentage |
|---|---|---|---|
| A | 97673 | 1006 | 1.029967% |
| B | 97674 | 1299 | 1.329934% |
| C | 97674 | 1610 | 1.648340% |
| D | 97673 | 1564 | 1.601261% |
Noise dominated data is calculated using 1-second bins in cleaned event files. If a bin has >2000 counts, and if more than 50% of those come from <1% of pixels, then it is considered to be noise-dominated and hence unusable.
| Quadrant | # 1 sec bins | Bins with >0 counts | Bins with >2000 counts | High rate bins dominated by noise | Noise dominated (total time) | Noise dominated (detector-on time) | Marked lightcurve |
|---|---|---|---|---|---|---|---|
| A | 114928 | 97671 | 0 | 0 | 0.00% | 0.00% |  |
| B | 114928 | 97670 | 0 | 0 | 0.00% | 0.00% |  |
| C | 114928 | 97668 | 0 | 0 | 0.00% | 0.00% |  |
| D | 114928 | 97671 | 82 | 82 | 0.07% | 0.08% |  |
Top three noisy pixels from each quadrant. If the there are fewer than three noisy pixels in the level2.evt file, extra rows are filled as -1
| Pixel properties | Quadrant properties | ||||||
|---|---|---|---|---|---|---|---|
| Quadrant | DetID | PixID | Counts | Sigma | Mean | Median | Sigma |
| A | 0 | 226 | 34438 | 25.72 | 5308 | 5216 | 1136.1 |
| A | 12 | 194 | 33430 | 24.83 | 5308 | 5216 | 1136.1 |
| A | 15 | 31 | 33032 | 24.48 | 5308 | 5216 | 1136.1 |
| B | 4 | 173 | 214261 | 209.01 | 5352 | 5220 | 1000.1 |
| B | 0 | 230 | 139578 | 134.34 | 5352 | 5220 | 1000.1 |
| B | 0 | 229 | 97571 | 92.34 | 5352 | 5220 | 1000.1 |
| C | 3 | 233 | 625829 | 530.47 | 5054 | 5031 | 1170.3 |
| C | 9 | 54 | 123700 | 101.4 | 5054 | 5031 | 1170.3 |
| C | 13 | 61 | 29669 | 21.05 | 5054 | 5031 | 1170.3 |
| D | 5 | 222 | 3979549 | 3401.58 | 5144 | 4981 | 1168.4 |
| D | 2 | 152 | 528961 | 448.44 | 5144 | 4981 | 1168.4 |
| D | 2 | 234 | 328208 | 276.63 | 5144 | 4981 | 1168.4 |
Histogram calculated using DETX and DETY for each event in the final _common_clean file
| Quadrant A |  |
 |
Quadrant B |
|---|---|---|---|
| Quadrant D |  |
 |
Quadrant C |
| Plot type | Count rate plots | Images |
|---|---|---|
| Comparison with Poisson distribution Blue bars denote a histogram of data divided into 1 sec bins. Red curve is a Poisson curve with rate = median count rate of data. |
 |
 |
| Quadrant-wise count rates Data is divided into 100 sec bins |
 |
|
| Module-wise count rates for Quadrant A Data is divided into 100 sec bins |
 |
 |
| Module-wise count rates for Quadrant B Data is divided into 100 sec bins |
 |
 |
| Module-wise count rates for Quadrant C Data is divided into 100 sec bins |
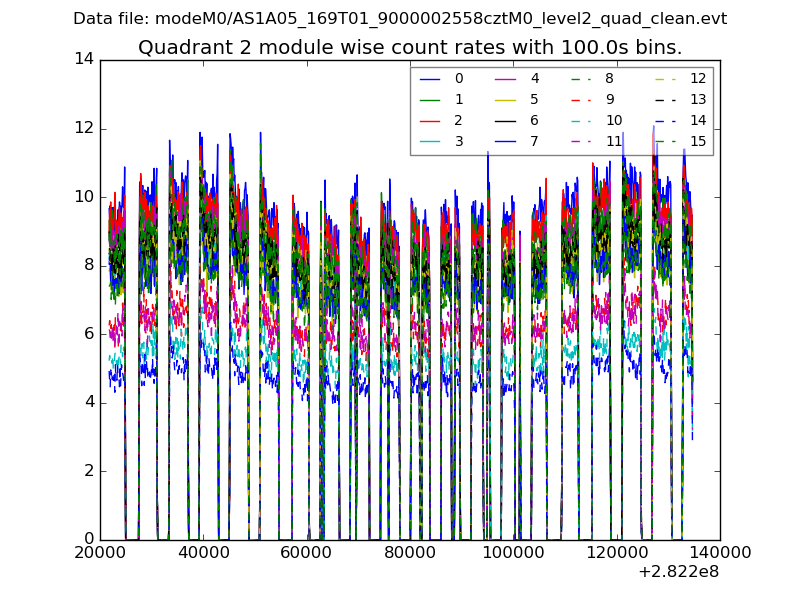 |
 |
| Module-wise count rates for Quadrant D Data is divided into 100 sec bins |
 |
 |
| Parameter | Plot |
|---|---|
| CZT HV Monitor |  |
| D_VDD |  |
| Temperature 1 | 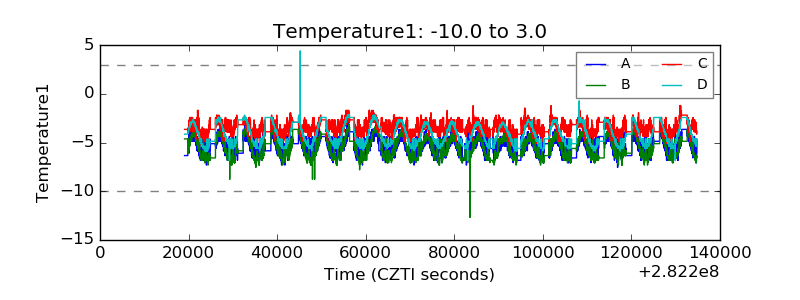 |
| Veto HV Monitor |  |
| Veto LLD |  |
| Alpha Counter | 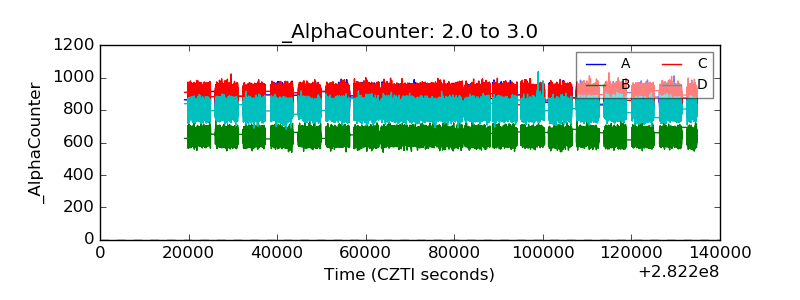 |
| _CPM_Rate |  |
| CZT Counter |  |
| +2.5 Volts monitor | 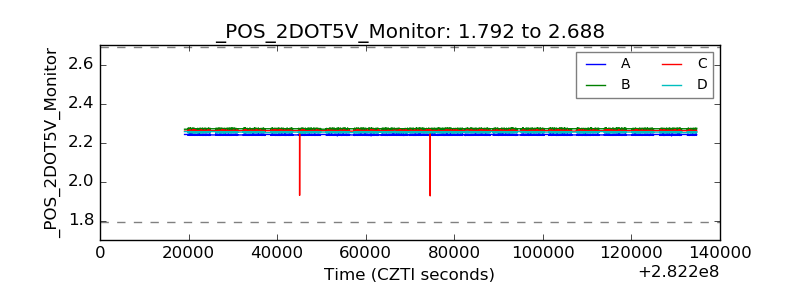 |
| +5 Volts monitor |  |
| _ROLL_ROT |  |
| _Roll_DEC |  |
| _Roll_RA |  |
| Veto Counter |  |