| Param | Original file | Final file |
|---|---|---|
| Filename | modeM0/AS1A05_010T02_9000002556cztM0_level2_bc.evt | modeM0/AS1A05_010T02_9000002556cztM0_level2_quad_clean.evt |
| Size (bytes) | 6,504,048,000 | 2,391,819,840 |
| Size | 6.1 GB | 2.2 GB |
| Events in quadrant A | 38,437,706 | 15,475,836 |
| Events in quadrant B | 37,055,733 | 15,559,118 |
| Events in quadrant C | 35,342,913 | 14,664,148 |
| Events in quadrant D | 73,618,479 | 14,153,408 |
| Mode SS | |||
|---|---|---|---|
| Quadrant | BADHDUFLAG | Total packets | Discarded packets |
| A | 0 | 3736 | 0 |
| B | 0 | 3736 | 0 |
| C | 0 | 3736 | 0 |
| D | 0 | 3736 | 0 |
| Mode M9 | |||
|---|---|---|---|
| Quadrant | BADHDUFLAG | Total packets | Discarded packets |
| A | 0 | 271 | 0 |
| B | 0 | 271 | 0 |
| C | 0 | 271 | 0 |
| D | 0 | 271 | 0 |
| Mode M0 | |||
|---|---|---|---|
| Quadrant | BADHDUFLAG | Total packets | Discarded packets |
| A | 0 | 384183 | 0 |
| B | 0 | 380364 | 0 |
| C | 0 | 379075 | 0 |
| D | 0 | 500565 | 0 |
| Quadrant | Total seconds | Saturated seconds | Saturation percentage |
|---|---|---|---|
| A | 183887 | 1830 | 0.995176% |
| B | 183887 | 2110 | 1.147444% |
| C | 183887 | 2490 | 1.354092% |
| D | 183887 | 10490 | 5.704590% |
Noise dominated data is calculated using 1-second bins in cleaned event files. If a bin has >2000 counts, and if more than 50% of those come from <1% of pixels, then it is considered to be noise-dominated and hence unusable.
| Quadrant | # 1 sec bins | Bins with >0 counts | Bins with >2000 counts | High rate bins dominated by noise | Noise dominated (total time) | Noise dominated (detector-on time) | Marked lightcurve |
|---|---|---|---|---|---|---|---|
| A | 210719 | 183891 | 50 | 50 | 0.02% | 0.03% | 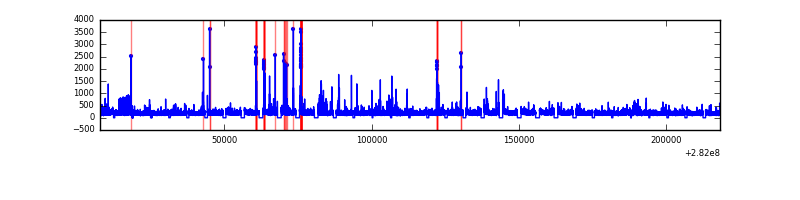 |
| B | 210719 | 183887 | 1 | 1 | 0.00% | 0.00% |  |
| C | 210719 | 183893 | 17 | 17 | 0.01% | 0.01% |  |
| D | 210719 | 183885 | 4014 | 4014 | 1.90% | 2.18% |  |
Top three noisy pixels from each quadrant. If the there are fewer than three noisy pixels in the level2.evt file, extra rows are filled as -1
| Pixel properties | Quadrant properties | ||||||
|---|---|---|---|---|---|---|---|
| Quadrant | DetID | PixID | Counts | Sigma | Mean | Median | Sigma |
| A | 0 | 23 | 1079242 | 521.6 | 9458 | 9277 | 2051.3 |
| A | 4 | 2 | 658575 | 316.53 | 9458 | 9277 | 2051.3 |
| A | 13 | 210 | 260330 | 122.39 | 9458 | 9277 | 2051.3 |
| B | 0 | 230 | 226944 | 121.8 | 9524 | 9282 | 1787.1 |
| B | 0 | 229 | 157566 | 82.98 | 9524 | 9282 | 1787.1 |
| B | 0 | 214 | 109535 | 56.1 | 9524 | 9282 | 1787.1 |
| C | 3 | 233 | 423265 | 198.52 | 8986 | 8920 | 2087.1 |
| C | 7 | 220 | 109952 | 48.41 | 8986 | 8920 | 2087.1 |
| C | 14 | 128 | 102256 | 44.72 | 8986 | 8920 | 2087.1 |
| D | 11 | 176 | 18869048 | 9066.69 | 9027 | 8715 | 2080.2 |
| D | 5 | 222 | 9507495 | 4566.33 | 9027 | 8715 | 2080.2 |
| D | 13 | 232 | 5157726 | 2475.27 | 9027 | 8715 | 2080.2 |
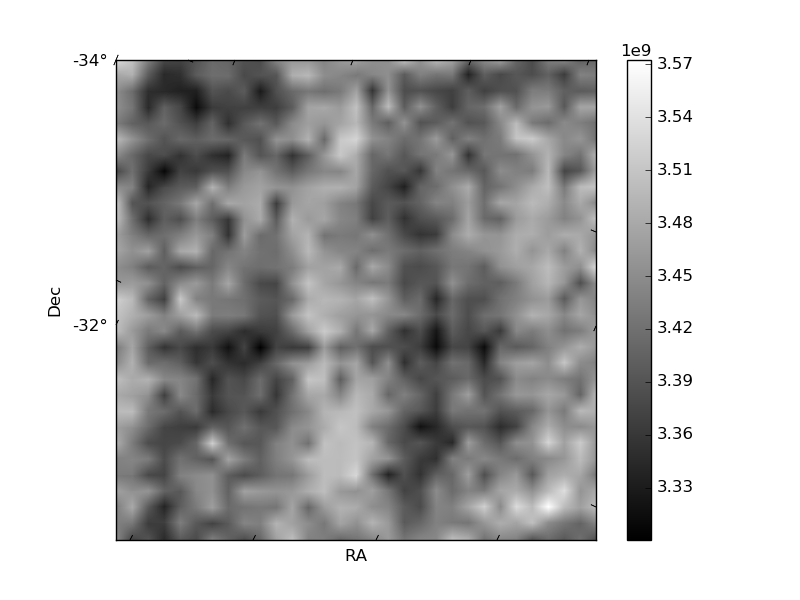
Histogram calculated using DETX and DETY for each event in the final _common_clean file
| Quadrant A |  |
 |
Quadrant B |
|---|---|---|---|
| Quadrant D |  |
 |
Quadrant C |
| Plot type | Count rate plots | Images |
|---|---|---|
| Comparison with Poisson distribution Blue bars denote a histogram of data divided into 1 sec bins. Red curve is a Poisson curve with rate = median count rate of data. |
 |
 |
| Quadrant-wise count rates Data is divided into 100 sec bins |
 |
|
| Module-wise count rates for Quadrant A Data is divided into 100 sec bins |
 |
 |
| Module-wise count rates for Quadrant B Data is divided into 100 sec bins |
 |
 |
| Module-wise count rates for Quadrant C Data is divided into 100 sec bins |
 |
 |
| Module-wise count rates for Quadrant D Data is divided into 100 sec bins |
 |
 |
| Parameter | Plot |
|---|---|
| CZT HV Monitor |  |
| D_VDD |  |
| Temperature 1 |  |
| Veto HV Monitor |  |
| Veto LLD |  |
| Alpha Counter |  |
| _CPM_Rate |  |
| CZT Counter |  |
| +2.5 Volts monitor |  |
| +5 Volts monitor |  |
| _ROLL_ROT |  |
| _Roll_DEC |  |
| _Roll_RA |  |
| Veto Counter |  |