| Param | Original file | Final file |
|---|---|---|
| Filename | modeM0/AS1T03_059T01_9000002554cztM0_level2_bc.evt | modeM0/AS1T03_059T01_9000002554cztM0_level2_quad_clean.evt |
| Size (bytes) | 5,886,224,640 | 1,693,051,200 |
| Size | 5.5 GB | 1.6 GB |
| Events in quadrant A | 38,964,839 | 10,915,191 |
| Events in quadrant B | 26,751,725 | 11,219,384 |
| Events in quadrant C | 26,090,036 | 10,551,322 |
| Events in quadrant D | 77,538,764 | 9,609,013 |
| Mode M9 | |||
|---|---|---|---|
| Quadrant | BADHDUFLAG | Total packets | Discarded packets |
| A | 0 | 218 | 0 |
| B | 0 | 218 | 0 |
| C | 0 | 218 | 0 |
| D | 0 | 218 | 0 |
| Mode M0 | |||
|---|---|---|---|
| Quadrant | BADHDUFLAG | Total packets | Discarded packets |
| A | 0 | 317227 | 0 |
| B | 0 | 272225 | 0 |
| C | 0 | 273231 | 0 |
| D | 0 | 427344 | 0 |
| Mode SS | |||
|---|---|---|---|
| Quadrant | BADHDUFLAG | Total packets | Discarded packets |
| A | 0 | 2670 | 0 |
| B | 0 | 2670 | 0 |
| C | 0 | 2670 | 0 |
| D | 0 | 2670 | 0 |
| Quadrant | Total seconds | Saturated seconds | Saturation percentage |
|---|---|---|---|
| A | 131080 | 5421 | 4.135642% |
| B | 131107 | 1654 | 1.261565% |
| C | 131107 | 2007 | 1.530811% |
| D | 131107 | 16349 | 12.469967% |
Noise dominated data is calculated using 1-second bins in cleaned event files. If a bin has >2000 counts, and if more than 50% of those come from <1% of pixels, then it is considered to be noise-dominated and hence unusable.
| Quadrant | # 1 sec bins | Bins with >0 counts | Bins with >2000 counts | High rate bins dominated by noise | Noise dominated (total time) | Noise dominated (detector-on time) | Marked lightcurve |
|---|---|---|---|---|---|---|---|
| A | 158171 | 131084 | 1126 | 1126 | 0.71% | 0.86% |  |
| B | 158171 | 131102 | 2 | 2 | 0.00% | 0.00% | 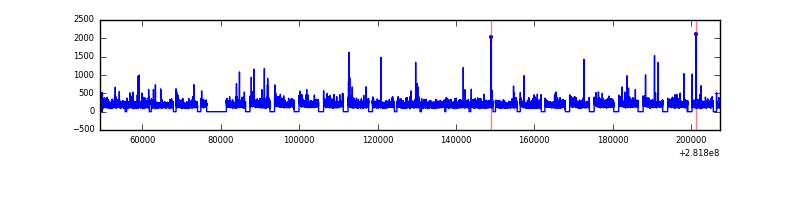 |
| C | 158171 | 131110 | 1 | 1 | 0.00% | 0.00% | 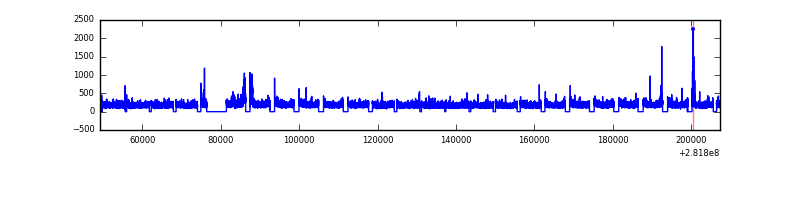 |
| D | 158171 | 131106 | 10211 | 10211 | 6.46% | 7.79% |  |
Top three noisy pixels from each quadrant. If the there are fewer than three noisy pixels in the level2.evt file, extra rows are filled as -1
| Pixel properties | Quadrant properties | ||||||
|---|---|---|---|---|---|---|---|
| Quadrant | DetID | PixID | Counts | Sigma | Mean | Median | Sigma |
| A | 14 | 235 | 11964484 | 8225.21 | 6726 | 6606 | 1453.8 |
| A | 0 | 23 | 710893 | 484.44 | 6726 | 6606 | 1453.8 |
| A | 13 | 210 | 315044 | 212.16 | 6726 | 6606 | 1453.8 |
| B | 0 | 230 | 152655 | 111.79 | 6894 | 6700 | 1305.6 |
| B | 0 | 229 | 105340 | 75.55 | 6894 | 6700 | 1305.6 |
| B | 15 | 19 | 68805 | 47.57 | 6894 | 6700 | 1305.6 |
| C | 3 | 233 | 1014370 | 668.56 | 6490 | 6450 | 1507.6 |
| C | 5 | 112 | 121630 | 76.4 | 6490 | 6450 | 1507.6 |
| C | 13 | 61 | 37323 | 20.48 | 6490 | 6450 | 1507.6 |
| D | 11 | 176 | 47061155 | 32535.04 | 6291 | 6082 | 1446.3 |
| D | 10 | 70 | 1243338 | 855.47 | 6291 | 6082 | 1446.3 |
| D | 1 | 52 | 1140428 | 784.31 | 6291 | 6082 | 1446.3 |
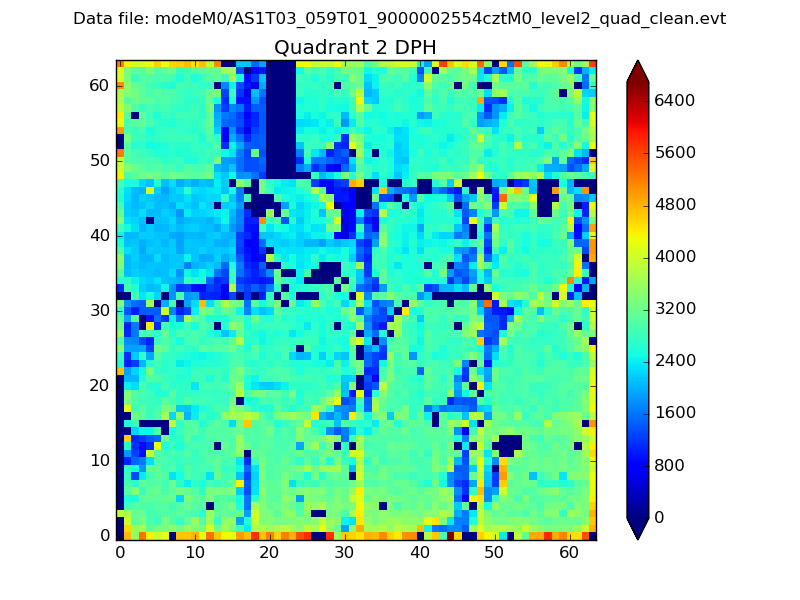
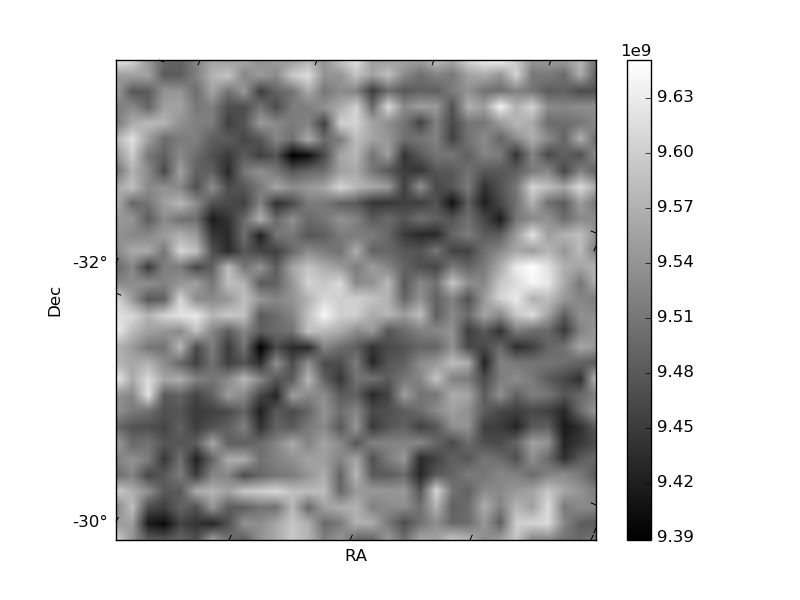
Histogram calculated using DETX and DETY for each event in the final _common_clean file
| Quadrant A |  |
 |
Quadrant B |
|---|---|---|---|
| Quadrant D |  |
 |
Quadrant C |
| Plot type | Count rate plots | Images |
|---|---|---|
| Comparison with Poisson distribution Blue bars denote a histogram of data divided into 1 sec bins. Red curve is a Poisson curve with rate = median count rate of data. |
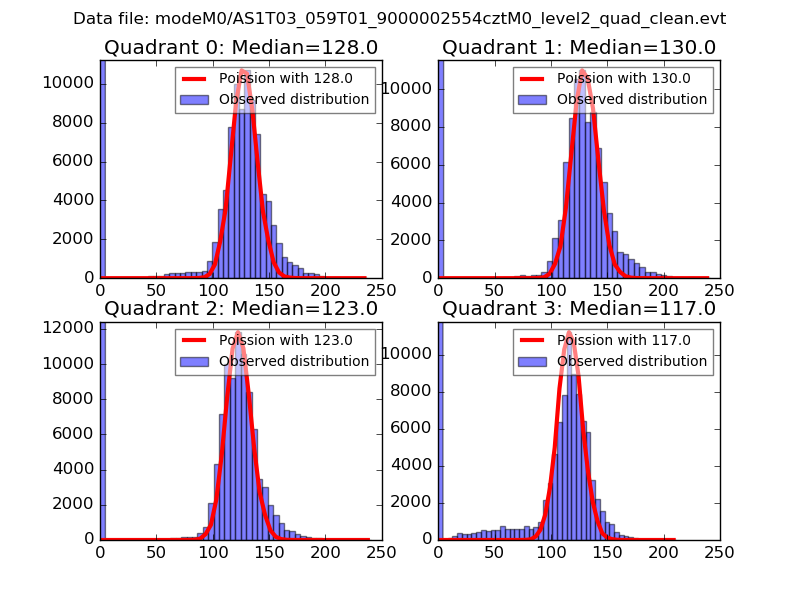 |
 |
| Quadrant-wise count rates Data is divided into 100 sec bins |
 |
|
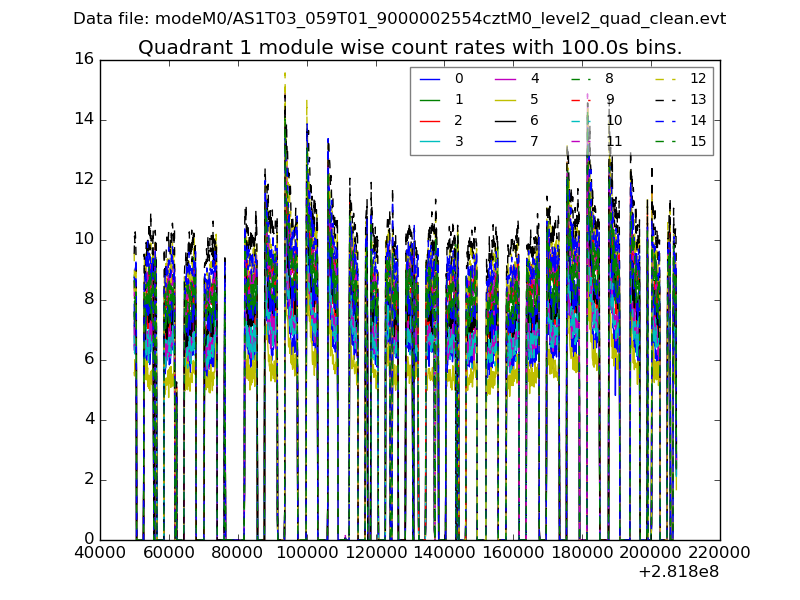
| Module-wise count rates for Quadrant A Data is divided into 100 sec bins |
 |
 |
| Module-wise count rates for Quadrant B Data is divided into 100 sec bins |
 |
 |
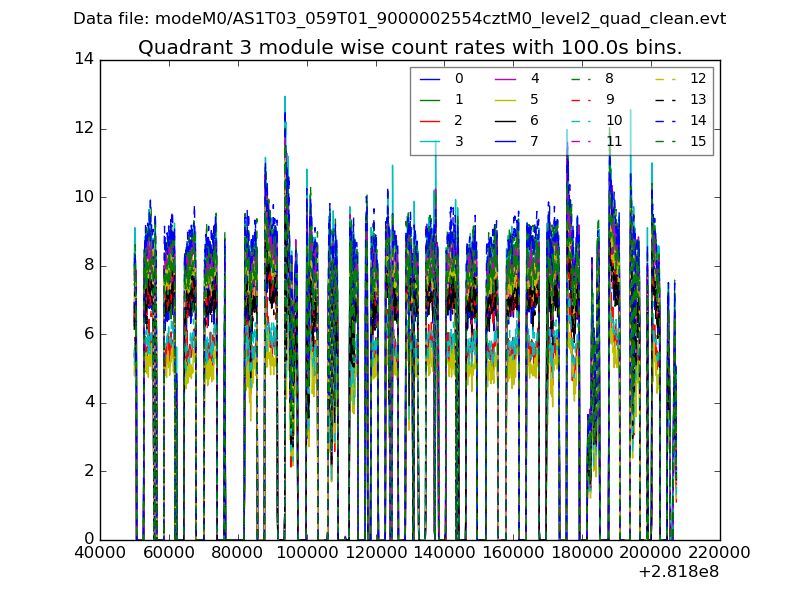
| Module-wise count rates for Quadrant C Data is divided into 100 sec bins |
 |
 |
| Module-wise count rates for Quadrant D Data is divided into 100 sec bins |
 |
 |
| Parameter | Plot |
|---|---|
| CZT HV Monitor | 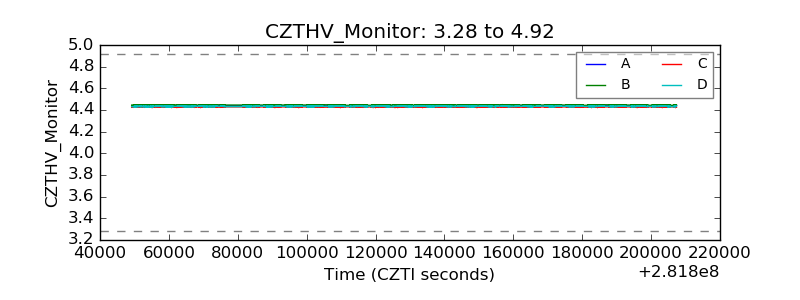 |
| D_VDD |  |
| Temperature 1 |  |
| Veto HV Monitor | 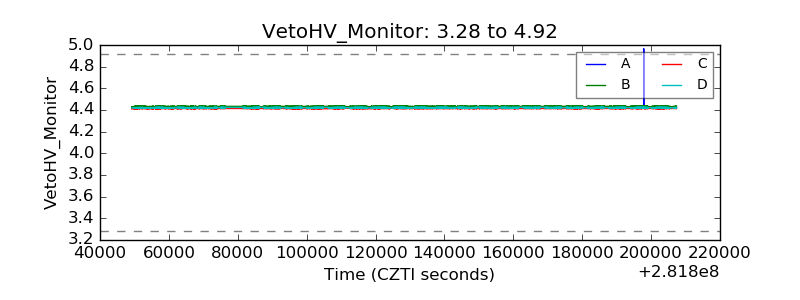 |
| Veto LLD | 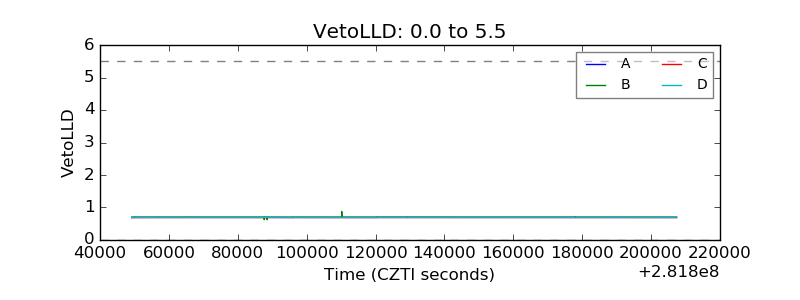 |
| Alpha Counter |  |
| _CPM_Rate |  |
| CZT Counter |  |
| +2.5 Volts monitor | 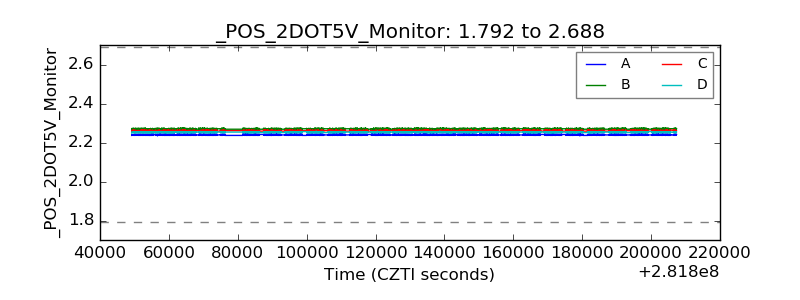 |
| +5 Volts monitor |  |
| _ROLL_ROT | 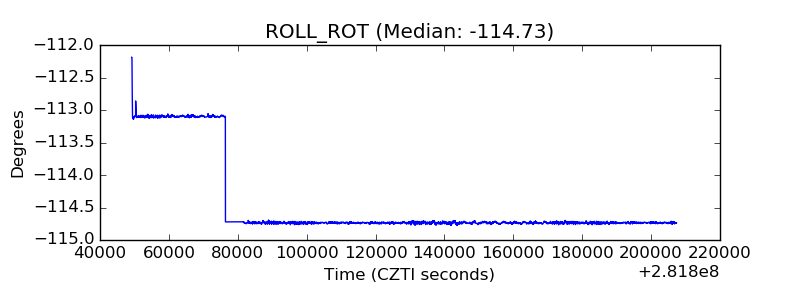 |
| _Roll_DEC |  |
| _Roll_RA |  |
| Veto Counter | 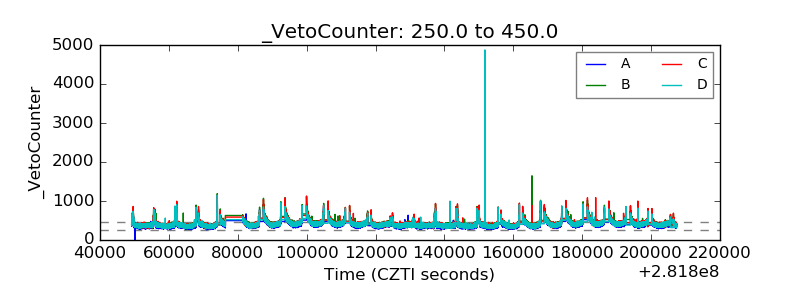 |