| Param | Original file | Final file |
|---|---|---|
| Filename | modeM0/AS1A05_185T04_9000002552cztM0_level2_bc.evt | modeM0/AS1A05_185T04_9000002552cztM0_level2_quad_clean.evt |
| Size (bytes) | 1,641,925,440 | 689,546,880 |
| Size | 1.5 GB | 657.6 MB |
| Events in quadrant A | 11,333,692 | 4,449,815 |
| Events in quadrant B | 11,448,422 | 4,440,143 |
| Events in quadrant C | 10,501,803 | 4,212,359 |
| Events in quadrant D | 12,846,653 | 4,169,646 |
| Mode SS | |||
|---|---|---|---|
| Quadrant | BADHDUFLAG | Total packets | Discarded packets |
| A | 0 | 1068 | 0 |
| B | 0 | 1068 | 0 |
| C | 0 | 1068 | 0 |
| D | 0 | 1068 | 0 |
| Mode M0 | |||
|---|---|---|---|
| Quadrant | BADHDUFLAG | Total packets | Discarded packets |
| A | 0 | 109421 | 0 |
| B | 0 | 111114 | 0 |
| C | 0 | 108689 | 0 |
| D | 0 | 115461 | 0 |
| Mode M9 | |||
|---|---|---|---|
| Quadrant | BADHDUFLAG | Total packets | Discarded packets |
| A | 0 | 94 | 0 |
| B | 0 | 94 | 0 |
| C | 0 | 94 | 0 |
| D | 0 | 94 | 0 |
| Quadrant | Total seconds | Saturated seconds | Saturation percentage |
|---|---|---|---|
| A | 52693 | 381 | 0.723056% |
| B | 52693 | 513 | 0.973564% |
| C | 52693 | 584 | 1.108307% |
| D | 52692 | 813 | 1.542929% |
Noise dominated data is calculated using 1-second bins in cleaned event files. If a bin has >2000 counts, and if more than 50% of those come from <1% of pixels, then it is considered to be noise-dominated and hence unusable.
| Quadrant | # 1 sec bins | Bins with >0 counts | Bins with >2000 counts | High rate bins dominated by noise | Noise dominated (total time) | Noise dominated (detector-on time) | Marked lightcurve |
|---|---|---|---|---|---|---|---|
| A | 67247 | 52695 | 4 | 4 | 0.01% | 0.01% |  |
| B | 67247 | 52694 | 4 | 4 | 0.01% | 0.01% |  |
| C | 67247 | 52697 | 0 | 0 | 0.00% | 0.00% | 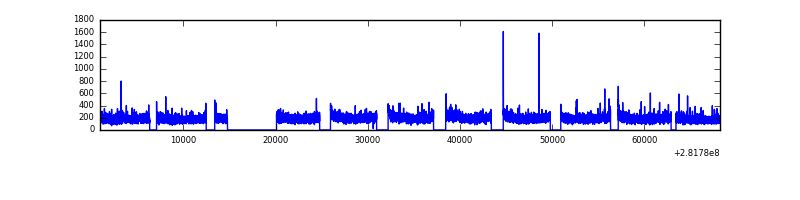 |
| D | 67247 | 52692 | 100 | 100 | 0.15% | 0.19% |  |
Top three noisy pixels from each quadrant. If the there are fewer than three noisy pixels in the level2.evt file, extra rows are filled as -1
| Pixel properties | Quadrant properties | ||||||
|---|---|---|---|---|---|---|---|
| Quadrant | DetID | PixID | Counts | Sigma | Mean | Median | Sigma |
| A | 0 | 23 | 528642 | 871.24 | 2780 | 2729 | 603.6 |
| A | 15 | 174 | 101918 | 164.32 | 2780 | 2729 | 603.6 |
| A | 0 | 226 | 48939 | 76.55 | 2780 | 2729 | 603.6 |
| B | 0 | 189 | 172882 | 326.72 | 2781 | 2712 | 520.8 |
| B | 7 | 220 | 169740 | 320.69 | 2781 | 2712 | 520.8 |
| B | 0 | 197 | 124197 | 233.25 | 2781 | 2712 | 520.8 |
| C | 3 | 233 | 274381 | 440.53 | 2643 | 2627 | 616.9 |
| C | 1 | 16 | 38152 | 57.59 | 2643 | 2627 | 616.9 |
| C | 13 | 61 | 15745 | 21.27 | 2643 | 2627 | 616.9 |
| D | 1 | 52 | 772051 | 1240.58 | 2722 | 2641 | 620.2 |
| D | 10 | 70 | 611212 | 981.25 | 2722 | 2641 | 620.2 |
| D | 13 | 189 | 553165 | 887.66 | 2722 | 2641 | 620.2 |
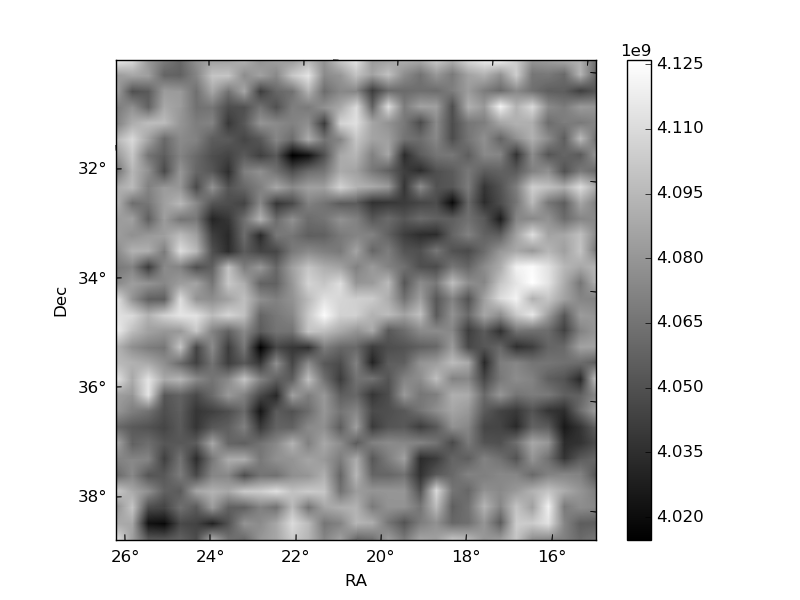
Histogram calculated using DETX and DETY for each event in the final _common_clean file
| Quadrant A |  |
 |
Quadrant B |
|---|---|---|---|
| Quadrant D |  |
 |
Quadrant C |
| Plot type | Count rate plots | Images |
|---|---|---|
| Comparison with Poisson distribution Blue bars denote a histogram of data divided into 1 sec bins. Red curve is a Poisson curve with rate = median count rate of data. |
 |
 |
| Quadrant-wise count rates Data is divided into 100 sec bins |
 |
|
| Module-wise count rates for Quadrant A Data is divided into 100 sec bins |
 |
 |
| Module-wise count rates for Quadrant B Data is divided into 100 sec bins |
 |
 |
| Module-wise count rates for Quadrant C Data is divided into 100 sec bins |
 |
 |
| Module-wise count rates for Quadrant D Data is divided into 100 sec bins |
 |
 |
| Parameter | Plot |
|---|---|
| CZT HV Monitor |  |
| D_VDD |  |
| Temperature 1 |  |
| Veto HV Monitor | 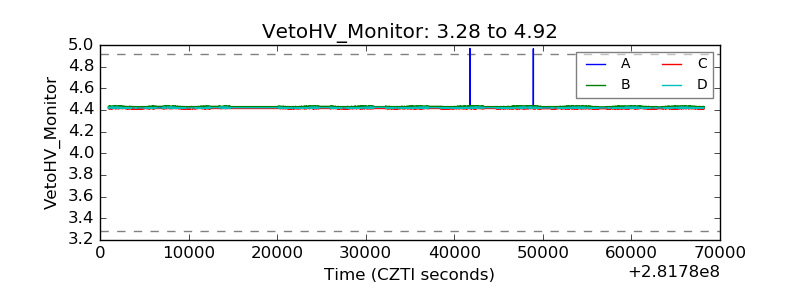 |
| Veto LLD | 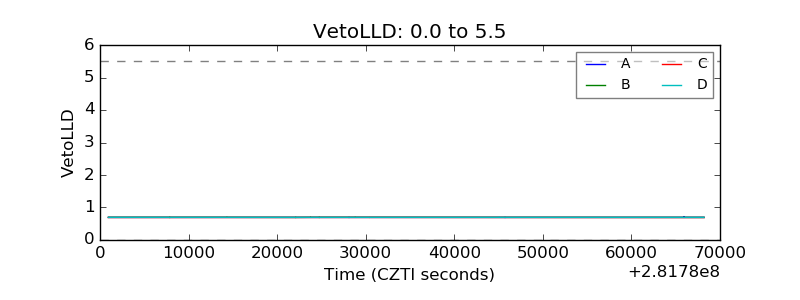 |
| Alpha Counter | 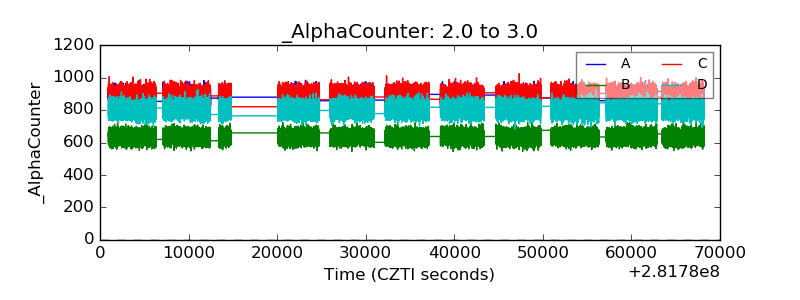 |
| _CPM_Rate |  |
| CZT Counter | 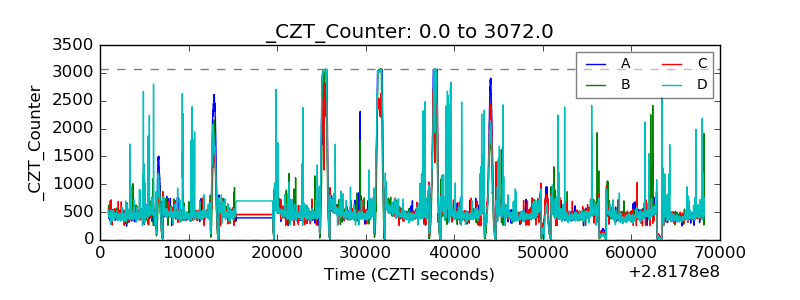 |
| +2.5 Volts monitor |  |
| +5 Volts monitor |  |
| _ROLL_ROT |  |
| _Roll_DEC | 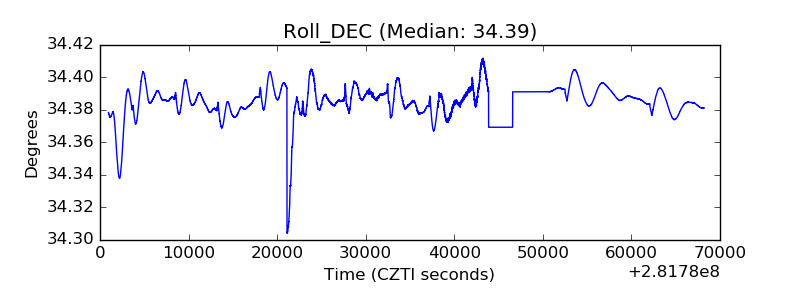 |
| _Roll_RA |  |
| Veto Counter | 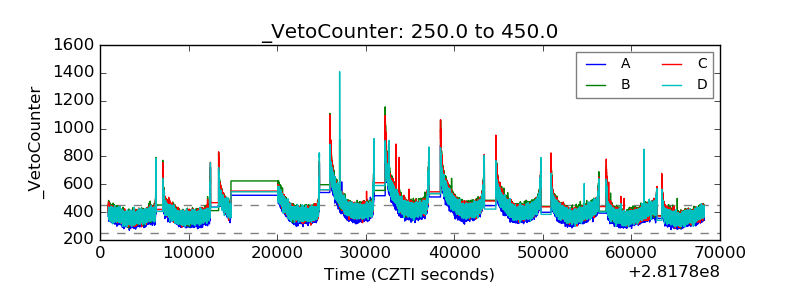 |