| Param | Original file | Final file |
|---|---|---|
| Filename | modeM0/AS1T03_063T01_9000002550cztM0_level2_bc.evt | modeM0/AS1T03_063T01_9000002550cztM0_level2_quad_clean.evt |
| Size (bytes) | 2,203,225,920 | 843,353,280 |
| Size | 2.1 GB | 804.3 MB |
| Events in quadrant A | 14,166,143 | 5,313,683 |
| Events in quadrant B | 15,632,761 | 5,392,908 |
| Events in quadrant C | 14,214,986 | 5,171,536 |
| Events in quadrant D | 18,122,285 | 5,051,919 |
| Mode M0 | |||
|---|---|---|---|
| Quadrant | BADHDUFLAG | Total packets | Discarded packets |
| A | 0 | 141311 | 0 |
| B | 0 | 147603 | 0 |
| C | 0 | 142187 | 0 |
| D | 0 | 155931 | 0 |
| Mode M9 | |||
|---|---|---|---|
| Quadrant | BADHDUFLAG | Total packets | Discarded packets |
| A | 0 | 110 | 0 |
| B | 0 | 110 | 0 |
| C | 0 | 110 | 0 |
| D | 0 | 110 | 0 |
| Mode SS | |||
|---|---|---|---|
| Quadrant | BADHDUFLAG | Total packets | Discarded packets |
| A | 0 | 1368 | 0 |
| B | 0 | 1368 | 0 |
| C | 0 | 1368 | 0 |
| D | 0 | 1368 | 0 |
| Quadrant | Total seconds | Saturated seconds | Saturation percentage |
|---|---|---|---|
| A | 67298 | 708 | 1.052037% |
| B | 67299 | 928 | 1.378921% |
| C | 67299 | 848 | 1.260048% |
| D | 67299 | 1308 | 1.943565% |
Noise dominated data is calculated using 1-second bins in cleaned event files. If a bin has >2000 counts, and if more than 50% of those come from <1% of pixels, then it is considered to be noise-dominated and hence unusable.
| Quadrant | # 1 sec bins | Bins with >0 counts | Bins with >2000 counts | High rate bins dominated by noise | Noise dominated (total time) | Noise dominated (detector-on time) | Marked lightcurve |
|---|---|---|---|---|---|---|---|
| A | 78270 | 67299 | 18 | 18 | 0.02% | 0.03% |  |
| B | 78270 | 67301 | 14 | 14 | 0.02% | 0.02% |  |
| C | 78270 | 67300 | 3 | 3 | 0.00% | 0.00% |  |
| D | 78270 | 67298 | 139 | 139 | 0.18% | 0.21% | 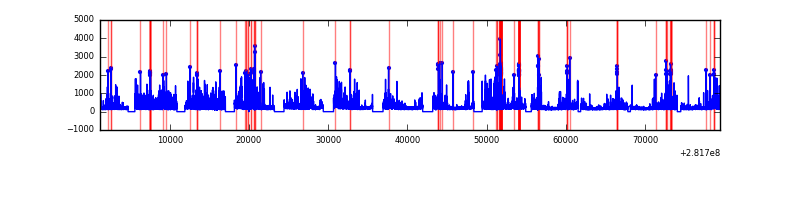 |
Top three noisy pixels from each quadrant. If the there are fewer than three noisy pixels in the level2.evt file, extra rows are filled as -1
| Pixel properties | Quadrant properties | ||||||
|---|---|---|---|---|---|---|---|
| Quadrant | DetID | PixID | Counts | Sigma | Mean | Median | Sigma |
| A | 15 | 174 | 322710 | 414.85 | 3558 | 3487 | 769.5 |
| A | 0 | 23 | 155148 | 197.09 | 3558 | 3487 | 769.5 |
| A | 0 | 226 | 31969 | 37.01 | 3558 | 3487 | 769.5 |
| B | 7 | 220 | 516095 | 754.02 | 3599 | 3503 | 679.8 |
| B | 3 | 209 | 252773 | 366.67 | 3599 | 3503 | 679.8 |
| B | 0 | 189 | 244451 | 354.43 | 3599 | 3503 | 679.8 |
| C | 3 | 233 | 490073 | 613.13 | 3430 | 3415 | 793.7 |
| C | 7 | 220 | 326038 | 406.47 | 3430 | 3415 | 793.7 |
| C | 1 | 16 | 139422 | 171.35 | 3430 | 3415 | 793.7 |
| D | 1 | 52 | 1212949 | 1523.06 | 3487 | 3366 | 794.2 |
| D | 15 | 0 | 1044431 | 1310.87 | 3487 | 3366 | 794.2 |
| D | 13 | 189 | 769459 | 964.64 | 3487 | 3366 | 794.2 |
Histogram calculated using DETX and DETY for each event in the final _common_clean file
| Quadrant A |  |
 |
Quadrant B |
|---|---|---|---|
| Quadrant D | 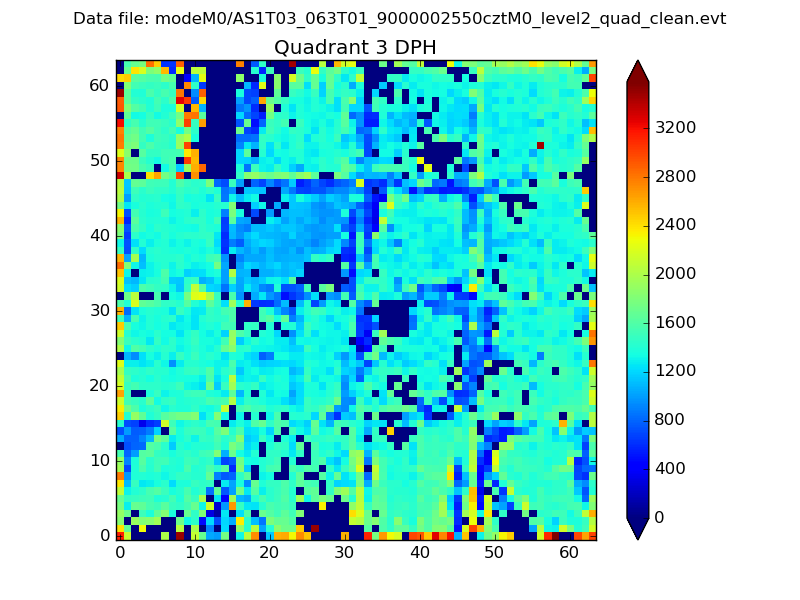 |
 |
Quadrant C |
| Plot type | Count rate plots | Images |
|---|---|---|
| Comparison with Poisson distribution Blue bars denote a histogram of data divided into 1 sec bins. Red curve is a Poisson curve with rate = median count rate of data. |
 |
 |
| Quadrant-wise count rates Data is divided into 100 sec bins |
 |
|
| Module-wise count rates for Quadrant A Data is divided into 100 sec bins |
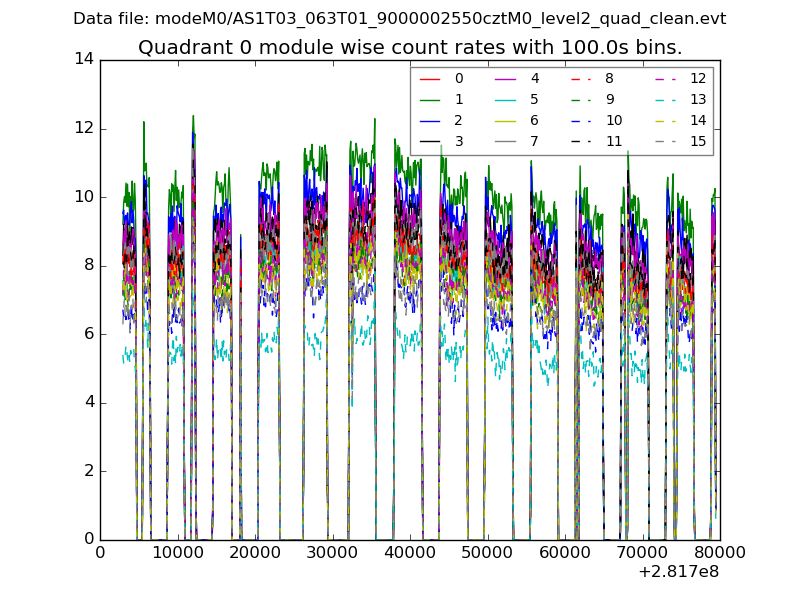 |
 |
| Module-wise count rates for Quadrant B Data is divided into 100 sec bins |
 |
 |
| Module-wise count rates for Quadrant C Data is divided into 100 sec bins |
 |
 |
| Module-wise count rates for Quadrant D Data is divided into 100 sec bins |
 |
 |
| Parameter | Plot |
|---|---|
| CZT HV Monitor |  |
| D_VDD |  |
| Temperature 1 |  |
| Veto HV Monitor |  |
| Veto LLD |  |
| Alpha Counter |  |
| _CPM_Rate |  |
| CZT Counter |  |
| +2.5 Volts monitor | 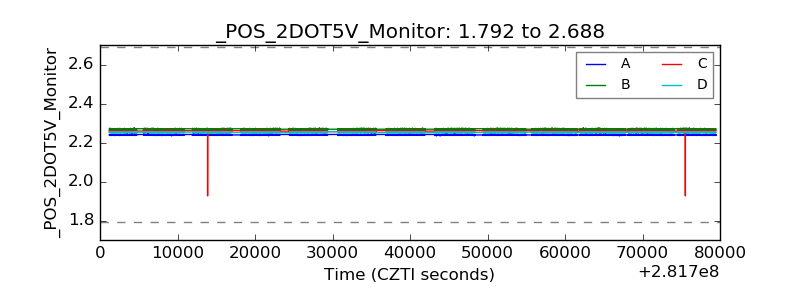 |
| +5 Volts monitor | 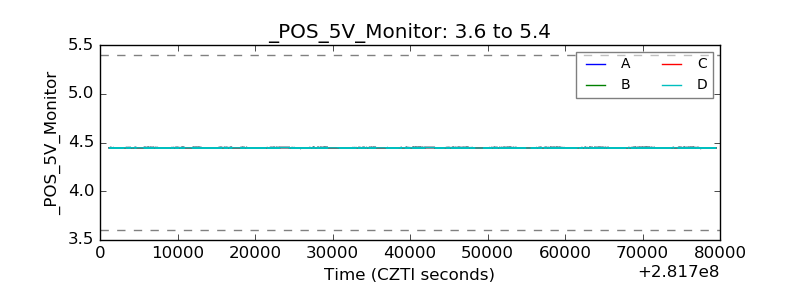 |
| _ROLL_ROT | 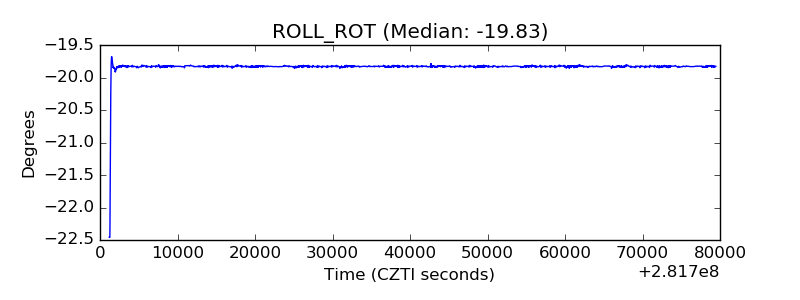 |
| _Roll_DEC |  |
| _Roll_RA |  |
| Veto Counter |  |