| Param | Original file | Final file |
|---|---|---|
| Filename | modeM0/AS1A05_185T04_9000002548cztM0_level2_bc.evt | modeM0/AS1A05_185T04_9000002548cztM0_level2_quad_clean.evt |
| Size (bytes) | 11,308,259,520 | 4,208,129,280 |
| Size | 10.5 GB | 3.9 GB |
| Events in quadrant A | 66,956,610 | 27,034,408 |
| Events in quadrant B | 71,380,782 | 27,062,012 |
| Events in quadrant C | 82,878,496 | 25,681,995 |
| Events in quadrant D | 98,993,869 | 25,290,855 |
| Mode M9 | |||
|---|---|---|---|
| Quadrant | BADHDUFLAG | Total packets | Discarded packets |
| A | 0 | 509 | 0 |
| B | 0 | 509 | 0 |
| C | 0 | 509 | 0 |
| D | 0 | 509 | 0 |
| Mode M0 | |||
|---|---|---|---|
| Quadrant | BADHDUFLAG | Total packets | Discarded packets |
| A | 0 | 675916 | 0 |
| B | 0 | 694493 | 0 |
| C | 0 | 743076 | 0 |
| D | 0 | 786042 | 0 |
| Mode SS | |||
|---|---|---|---|
| Quadrant | BADHDUFLAG | Total packets | Discarded packets |
| A | 0 | 6672 | 0 |
| B | 0 | 6672 | 0 |
| C | 0 | 6672 | 0 |
| D | 0 | 6672 | 0 |
| Quadrant | Total seconds | Saturated seconds | Saturation percentage |
|---|---|---|---|
| A | 327001 | 3414 | 1.044034% |
| B | 327001 | 4686 | 1.433023% |
| C | 327000 | 6313 | 1.930581% |
| D | 327000 | 9488 | 2.901529% |
Noise dominated data is calculated using 1-second bins in cleaned event files. If a bin has >2000 counts, and if more than 50% of those come from <1% of pixels, then it is considered to be noise-dominated and hence unusable.
| Quadrant | # 1 sec bins | Bins with >0 counts | Bins with >2000 counts | High rate bins dominated by noise | Noise dominated (total time) | Noise dominated (detector-on time) | Marked lightcurve |
|---|---|---|---|---|---|---|---|
| A | 378428 | 327002 | 28 | 28 | 0.01% | 0.01% |  |
| B | 378428 | 327000 | 45 | 45 | 0.01% | 0.01% |  |
| C | 378427 | 327000 | 41 | 41 | 0.01% | 0.01% |  |
| D | 378427 | 326994 | 1693 | 1693 | 0.45% | 0.52% |  |
Top three noisy pixels from each quadrant. If the there are fewer than three noisy pixels in the level2.evt file, extra rows are filled as -1
| Pixel properties | Quadrant properties | ||||||
|---|---|---|---|---|---|---|---|
| Quadrant | DetID | PixID | Counts | Sigma | Mean | Median | Sigma |
| A | 12 | 189 | 1508539 | 408.1 | 16817 | 16506 | 3656.0 |
| A | 4 | 2 | 398308 | 104.43 | 16817 | 16506 | 3656.0 |
| A | 0 | 23 | 268984 | 69.06 | 16817 | 16506 | 3656.0 |
| B | 7 | 220 | 1284598 | 398.3 | 16891 | 16455 | 3183.9 |
| B | 0 | 219 | 961650 | 296.87 | 16891 | 16455 | 3183.9 |
| B | 0 | 189 | 946103 | 291.99 | 16891 | 16455 | 3183.9 |
| C | 3 | 233 | 18789066 | 5035.75 | 16067 | 15963 | 3728.0 |
| C | 4 | 254 | 1913577 | 509.02 | 16067 | 15963 | 3728.0 |
| C | 13 | 61 | 95734 | 21.4 | 16067 | 15963 | 3728.0 |
| D | 5 | 222 | 18242929 | 4704.24 | 16492 | 15891 | 3874.6 |
| D | 1 | 52 | 5328560 | 1371.15 | 16492 | 15891 | 3874.6 |
| D | 11 | 176 | 2482488 | 636.61 | 16492 | 15891 | 3874.6 |
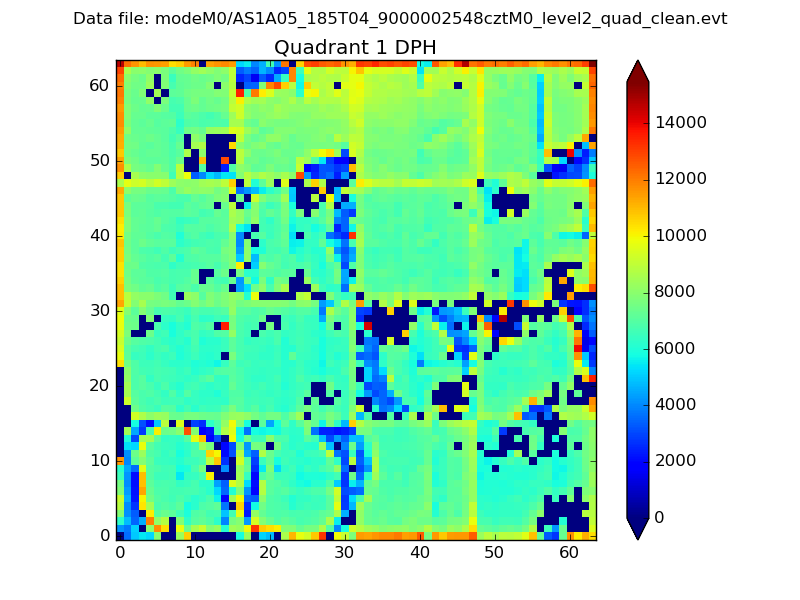
Histogram calculated using DETX and DETY for each event in the final _common_clean file
| Quadrant A |  |
 |
Quadrant B |
|---|---|---|---|
| Quadrant D |  |
 |
Quadrant C |
| Plot type | Count rate plots | Images |
|---|---|---|
| Comparison with Poisson distribution Blue bars denote a histogram of data divided into 1 sec bins. Red curve is a Poisson curve with rate = median count rate of data. |
 |
 |
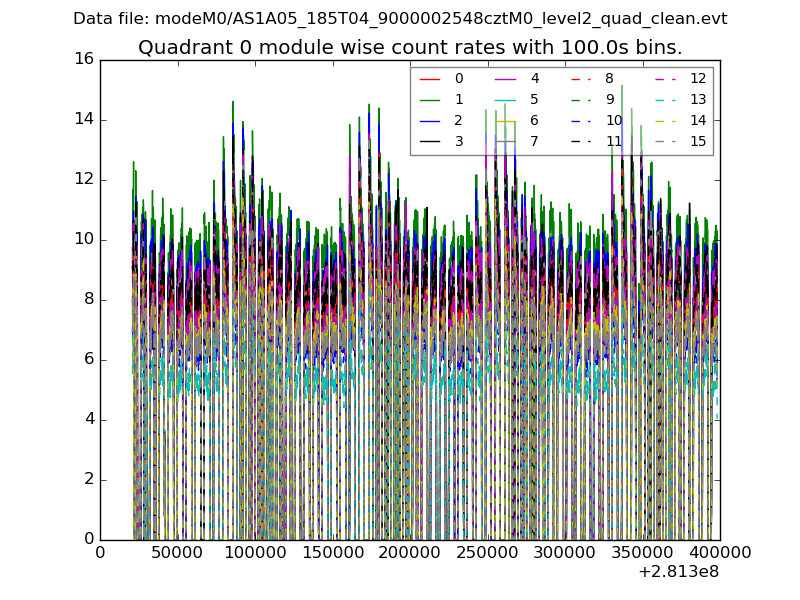
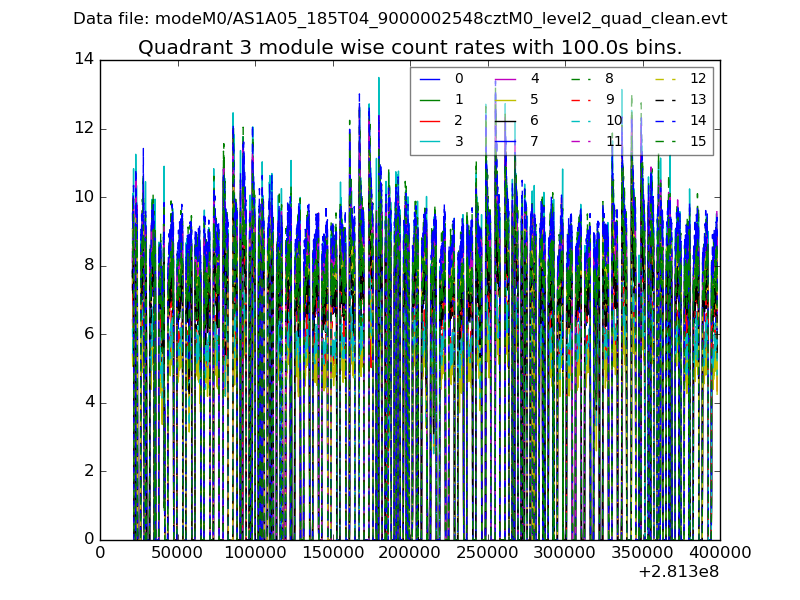
| Quadrant-wise count rates Data is divided into 100 sec bins |
 |
|
| Module-wise count rates for Quadrant A Data is divided into 100 sec bins |
 |
 |
| Module-wise count rates for Quadrant B Data is divided into 100 sec bins |
 |
 |
| Module-wise count rates for Quadrant C Data is divided into 100 sec bins |
 |
 |
| Module-wise count rates for Quadrant D Data is divided into 100 sec bins |
 |
 |
| Parameter | Plot |
|---|---|
| CZT HV Monitor |  |
| D_VDD |  |
| Temperature 1 |  |
| Veto HV Monitor |  |
| Veto LLD |  |
| Alpha Counter |  |
| _CPM_Rate |  |
| CZT Counter |  |
| +2.5 Volts monitor |  |
| +5 Volts monitor |  |
| _ROLL_ROT |  |
| _Roll_DEC | 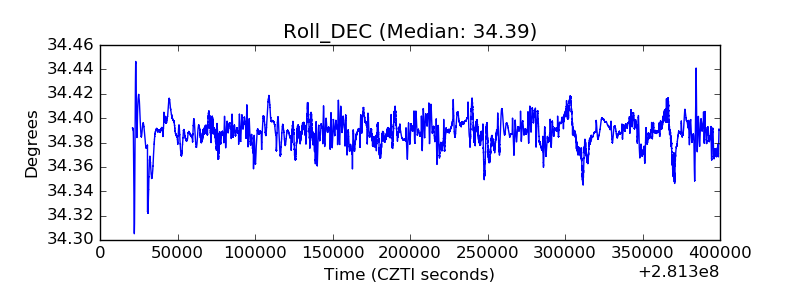 |
| _Roll_RA | 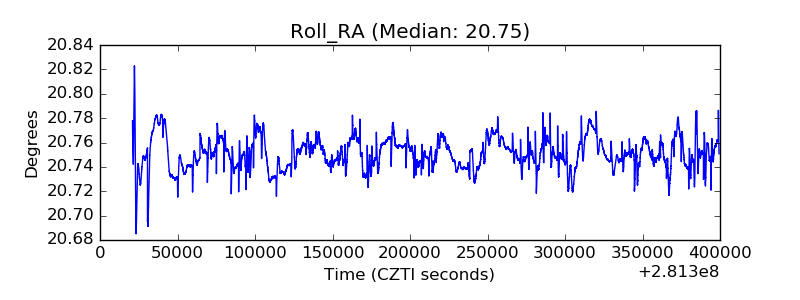 |
| Veto Counter |  |