| Param | Original file | Final file |
|---|---|---|
| Filename | modeM0/AS1T03_059T01_9000002546cztM0_level2_bc.evt | modeM0/AS1T03_059T01_9000002546cztM0_level2_quad_clean.evt |
| Size (bytes) | 2,363,428,800 | 942,765,120 |
| Size | 2.2 GB | 899.1 MB |
| Events in quadrant A | 15,512,906 | 6,018,688 |
| Events in quadrant B | 14,940,410 | 6,121,776 |
| Events in quadrant C | 19,354,717 | 5,706,893 |
| Events in quadrant D | 16,739,917 | 5,653,081 |
| Mode SS | |||
|---|---|---|---|
| Quadrant | BADHDUFLAG | Total packets | Discarded packets |
| A | 0 | 1504 | 0 |
| B | 0 | 1504 | 0 |
| C | 0 | 1504 | 0 |
| D | 0 | 1504 | 0 |
| Mode M9 | |||
|---|---|---|---|
| Quadrant | BADHDUFLAG | Total packets | Discarded packets |
| A | 0 | 113 | 0 |
| B | 0 | 113 | 0 |
| C | 0 | 113 | 0 |
| D | 0 | 113 | 0 |
| Mode M0 | |||
|---|---|---|---|
| Quadrant | BADHDUFLAG | Total packets | Discarded packets |
| A | 0 | 154083 | 0 |
| B | 0 | 152507 | 0 |
| C | 0 | 171445 | 0 |
| D | 0 | 159917 | 0 |
| Quadrant | Total seconds | Saturated seconds | Saturation percentage |
|---|---|---|---|
| A | 73702 | 1016 | 1.378524% |
| B | 73702 | 1093 | 1.482999% |
| C | 73702 | 1906 | 2.586090% |
| D | 73702 | 1496 | 2.029796% |
Noise dominated data is calculated using 1-second bins in cleaned event files. If a bin has >2000 counts, and if more than 50% of those come from <1% of pixels, then it is considered to be noise-dominated and hence unusable.
| Quadrant | # 1 sec bins | Bins with >0 counts | Bins with >2000 counts | High rate bins dominated by noise | Noise dominated (total time) | Noise dominated (detector-on time) | Marked lightcurve |
|---|---|---|---|---|---|---|---|
| A | 84611 | 73696 | 12 | 12 | 0.01% | 0.02% |  |
| B | 84611 | 73698 | 1 | 1 | 0.00% | 0.00% |  |
| C | 84611 | 73697 | 16 | 16 | 0.02% | 0.02% |  |
| D | 84611 | 73696 | 69 | 69 | 0.08% | 0.09% |  |
Top three noisy pixels from each quadrant. If the there are fewer than three noisy pixels in the level2.evt file, extra rows are filled as -1
| Pixel properties | Quadrant properties | ||||||
|---|---|---|---|---|---|---|---|
| Quadrant | DetID | PixID | Counts | Sigma | Mean | Median | Sigma |
| A | 12 | 96 | 447042 | 536.42 | 3806 | 3721 | 826.4 |
| A | 12 | 189 | 435352 | 522.28 | 3806 | 3721 | 826.4 |
| A | 4 | 2 | 44719 | 49.61 | 3806 | 3721 | 826.4 |
| B | 4 | 48 | 43185 | 53.81 | 3876 | 3767 | 732.6 |
| B | 0 | 219 | 43139 | 53.75 | 3876 | 3767 | 732.6 |
| B | 8 | 61 | 26318 | 30.78 | 3876 | 3767 | 732.6 |
| C | 3 | 233 | 4641607 | 5444.27 | 3654 | 3621 | 851.9 |
| C | 4 | 254 | 621947 | 725.82 | 3654 | 3621 | 851.9 |
| C | 13 | 61 | 21310 | 20.76 | 3654 | 3621 | 851.9 |
| D | 5 | 222 | 1584393 | 1855.77 | 3728 | 3597 | 851.8 |
| D | 1 | 52 | 302209 | 350.55 | 3728 | 3597 | 851.8 |
| D | 2 | 234 | 266502 | 308.64 | 3728 | 3597 | 851.8 |
Histogram calculated using DETX and DETY for each event in the final _common_clean file
| Quadrant A |  |
 |
Quadrant B |
|---|---|---|---|
| Quadrant D | 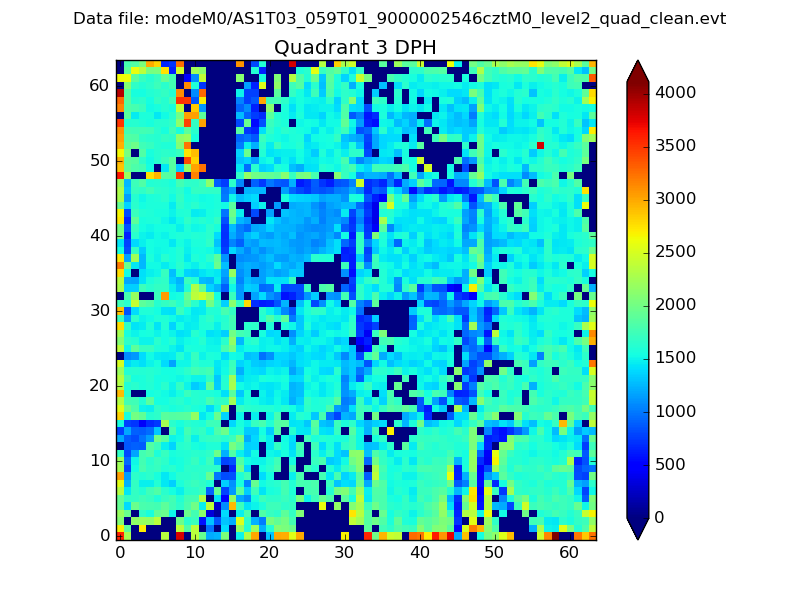 |
 |
Quadrant C |
| Plot type | Count rate plots | Images |
|---|---|---|
| Comparison with Poisson distribution Blue bars denote a histogram of data divided into 1 sec bins. Red curve is a Poisson curve with rate = median count rate of data. |
 |
 |
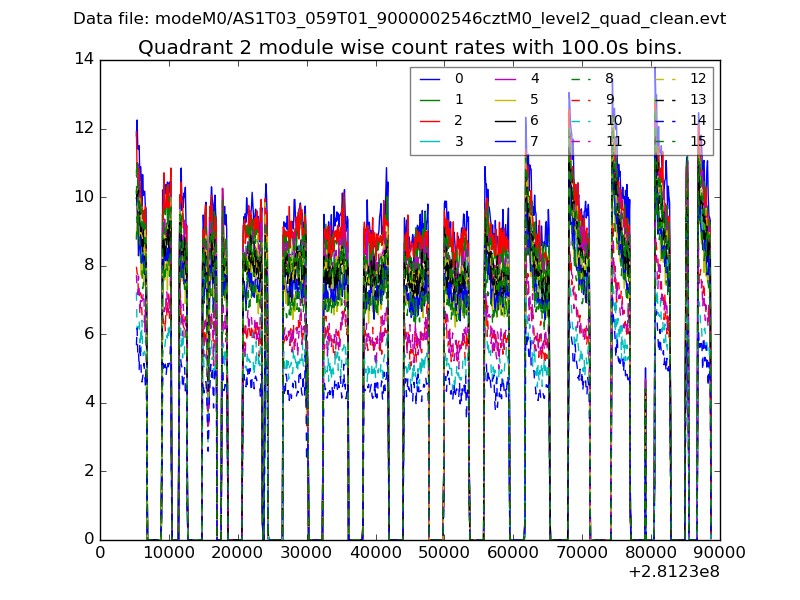
| Quadrant-wise count rates Data is divided into 100 sec bins |
 |
|
| Module-wise count rates for Quadrant A Data is divided into 100 sec bins |
 |
 |
| Module-wise count rates for Quadrant B Data is divided into 100 sec bins |
 |
 |
| Module-wise count rates for Quadrant C Data is divided into 100 sec bins |
 |
 |
| Module-wise count rates for Quadrant D Data is divided into 100 sec bins |
 |
 |
| Parameter | Plot |
|---|---|
| CZT HV Monitor | 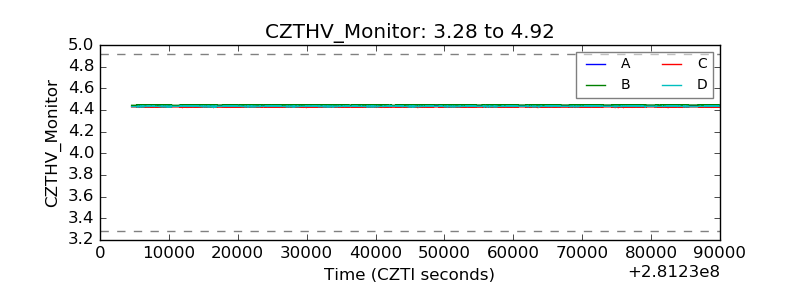 |
| D_VDD |  |
| Temperature 1 | 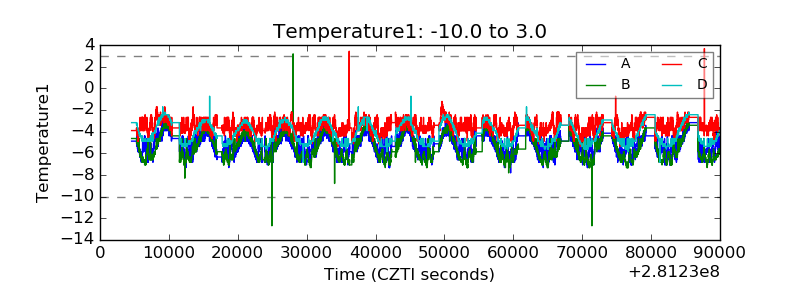 |
| Veto HV Monitor |  |
| Veto LLD |  |
| Alpha Counter | 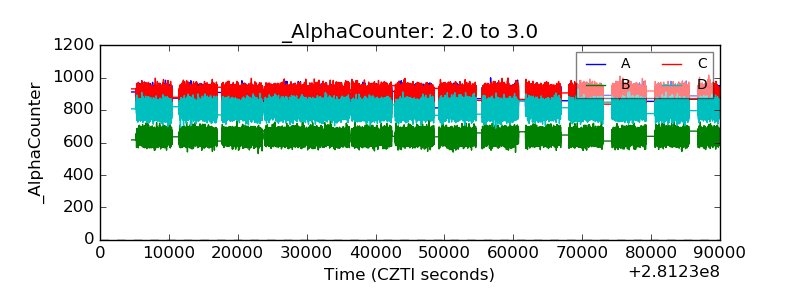 |
| _CPM_Rate |  |
| CZT Counter | 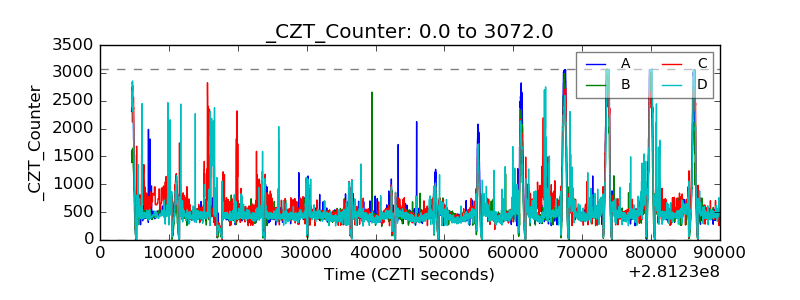 |
| +2.5 Volts monitor |  |
| +5 Volts monitor |  |
| _ROLL_ROT |  |
| _Roll_DEC |  |
| _Roll_RA |  |
| Veto Counter | 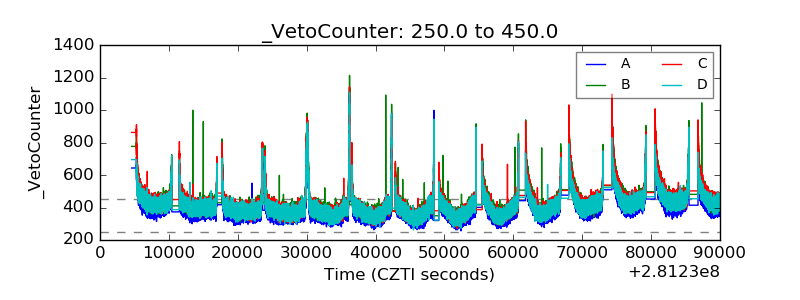 |