| Param | Original file | Final file |
|---|---|---|
| Filename | modeM0/AS1A05_056T01_9000002540cztM0_level2_bc.evt | modeM0/AS1A05_056T01_9000002540cztM0_level2_quad_clean.evt |
| Size (bytes) | 3,766,631,040 | 1,287,161,280 |
| Size | 3.5 GB | 1.2 GB |
| Events in quadrant A | 21,542,269 | 8,177,026 |
| Events in quadrant B | 21,334,426 | 8,366,043 |
| Events in quadrant C | 36,449,648 | 7,750,108 |
| Events in quadrant D | 27,793,101 | 7,696,729 |
| Mode M9 | |||
|---|---|---|---|
| Quadrant | BADHDUFLAG | Total packets | Discarded packets |
| A | 0 | 186 | 0 |
| B | 0 | 186 | 0 |
| C | 0 | 186 | 0 |
| D | 0 | 186 | 0 |
| Mode SS | |||
|---|---|---|---|
| Quadrant | BADHDUFLAG | Total packets | Discarded packets |
| A | 0 | 2082 | 0 |
| B | 0 | 2082 | 0 |
| C | 0 | 2082 | 0 |
| D | 0 | 2082 | 0 |
| Mode M0 | |||
|---|---|---|---|
| Quadrant | BADHDUFLAG | Total packets | Discarded packets |
| A | 0 | 213409 | 0 |
| B | 0 | 212500 | 0 |
| C | 0 | 277779 | 0 |
| D | 0 | 234695 | 0 |
| Quadrant | Total seconds | Saturated seconds | Saturation percentage |
|---|---|---|---|
| A | 102102 | 1369 | 1.340816% |
| B | 102102 | 1516 | 1.484790% |
| C | 102102 | 3824 | 3.745274% |
| D | 102102 | 2867 | 2.807976% |
Noise dominated data is calculated using 1-second bins in cleaned event files. If a bin has >2000 counts, and if more than 50% of those come from <1% of pixels, then it is considered to be noise-dominated and hence unusable.
| Quadrant | # 1 sec bins | Bins with >0 counts | Bins with >2000 counts | High rate bins dominated by noise | Noise dominated (total time) | Noise dominated (detector-on time) | Marked lightcurve |
|---|---|---|---|---|---|---|---|
| A | 119643 | 102103 | 22 | 22 | 0.02% | 0.02% |  |
| B | 119643 | 102100 | 1 | 1 | 0.00% | 0.00% |  |
| C | 119643 | 102095 | 5 | 5 | 0.00% | 0.00% |  |
| D | 119643 | 102102 | 327 | 327 | 0.27% | 0.32% |  |
Top three noisy pixels from each quadrant. If the there are fewer than three noisy pixels in the level2.evt file, extra rows are filled as -1
| Pixel properties | Quadrant properties | ||||||
|---|---|---|---|---|---|---|---|
| Quadrant | DetID | PixID | Counts | Sigma | Mean | Median | Sigma |
| A | 4 | 2 | 495377 | 422.43 | 5359 | 5256 | 1160.2 |
| A | 12 | 189 | 363415 | 308.69 | 5359 | 5256 | 1160.2 |
| A | 12 | 96 | 165591 | 138.19 | 5359 | 5256 | 1160.2 |
| B | 0 | 229 | 210976 | 201.5 | 5464 | 5321 | 1020.6 |
| B | 3 | 209 | 79245 | 72.43 | 5464 | 5321 | 1020.6 |
| B | 4 | 173 | 59580 | 53.16 | 5464 | 5321 | 1020.6 |
| C | 3 | 233 | 16430422 | 13827.71 | 5132 | 5099 | 1187.9 |
| C | 5 | 112 | 106638 | 85.48 | 5132 | 5099 | 1187.9 |
| C | 7 | 247 | 69796 | 54.47 | 5132 | 5099 | 1187.9 |
| D | 5 | 222 | 4967099 | 4173.65 | 5235 | 5061 | 1188.9 |
| D | 13 | 232 | 2160026 | 1812.58 | 5235 | 5061 | 1188.9 |
| D | 2 | 234 | 359432 | 298.07 | 5235 | 5061 | 1188.9 |
Histogram calculated using DETX and DETY for each event in the final _common_clean file
| Quadrant A |  |
 |
Quadrant B |
|---|---|---|---|
| Quadrant D |  |
 |
Quadrant C |
| Plot type | Count rate plots | Images |
|---|---|---|
| Comparison with Poisson distribution Blue bars denote a histogram of data divided into 1 sec bins. Red curve is a Poisson curve with rate = median count rate of data. |
 |
 |
| Quadrant-wise count rates Data is divided into 100 sec bins |
 |
|
| Module-wise count rates for Quadrant A Data is divided into 100 sec bins |
 |
 |
| Module-wise count rates for Quadrant B Data is divided into 100 sec bins |
 |
 |
| Module-wise count rates for Quadrant C Data is divided into 100 sec bins |
 |
 |
| Module-wise count rates for Quadrant D Data is divided into 100 sec bins |
 |
 |
| Parameter | Plot |
|---|---|
| CZT HV Monitor | 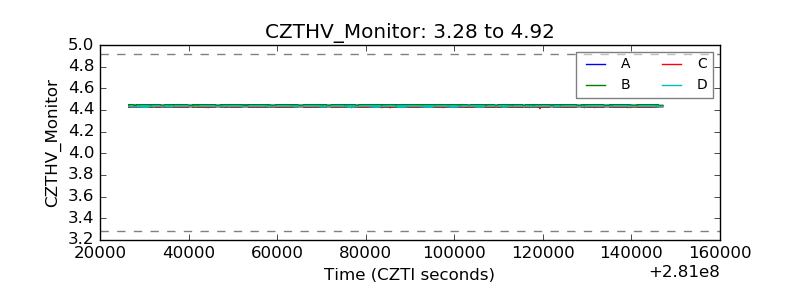 |
| D_VDD |  |
| Temperature 1 |  |
| Veto HV Monitor |  |
| Veto LLD | 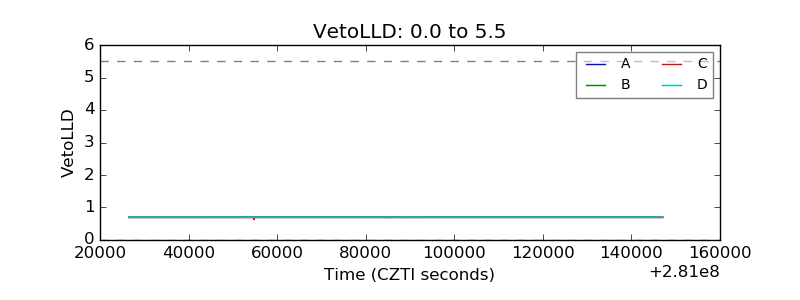 |
| Alpha Counter |  |
| _CPM_Rate |  |
| CZT Counter |  |
| +2.5 Volts monitor |  |
| +5 Volts monitor |  |
| _ROLL_ROT |  |
| _Roll_DEC |  |
| _Roll_RA | 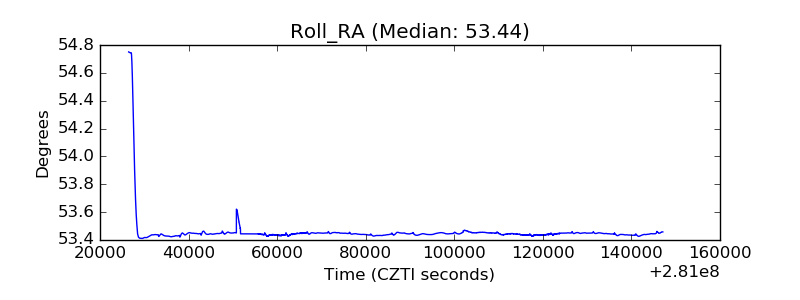 |
| Veto Counter | 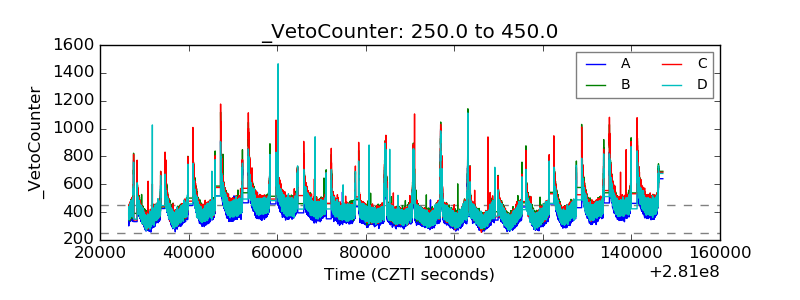 |