| Param | Original file | Final file |
|---|---|---|
| Filename | modeM0/AS1A05_004T03_9000002538cztM0_level2_bc.evt | modeM0/AS1A05_004T03_9000002538cztM0_level2_quad_clean.evt |
| Size (bytes) | 2,350,543,680 | 898,585,920 |
| Size | 2.2 GB | 857.0 MB |
| Events in quadrant A | 14,144,289 | 5,726,595 |
| Events in quadrant B | 15,447,874 | 5,804,236 |
| Events in quadrant C | 16,409,463 | 5,529,170 |
| Events in quadrant D | 20,402,528 | 5,348,212 |
| Mode M0 | |||
|---|---|---|---|
| Quadrant | BADHDUFLAG | Total packets | Discarded packets |
| A | 0 | 144306 | 0 |
| B | 0 | 148151 | 0 |
| C | 0 | 151131 | 0 |
| D | 0 | 165777 | 0 |
| Mode SS | |||
|---|---|---|---|
| Quadrant | BADHDUFLAG | Total packets | Discarded packets |
| A | 0 | 1434 | 0 |
| B | 0 | 1434 | 0 |
| C | 0 | 1434 | 0 |
| D | 0 | 1434 | 0 |
| Mode M9 | |||
|---|---|---|---|
| Quadrant | BADHDUFLAG | Total packets | Discarded packets |
| A | 0 | 112 | 0 |
| B | 0 | 112 | 0 |
| C | 0 | 112 | 0 |
| D | 0 | 112 | 0 |
| Quadrant | Total seconds | Saturated seconds | Saturation percentage |
|---|---|---|---|
| A | 70132 | 751 | 1.070838% |
| B | 70132 | 920 | 1.311812% |
| C | 70131 | 1170 | 1.668306% |
| D | 70132 | 1802 | 2.569440% |
Noise dominated data is calculated using 1-second bins in cleaned event files. If a bin has >2000 counts, and if more than 50% of those come from <1% of pixels, then it is considered to be noise-dominated and hence unusable.
| Quadrant | # 1 sec bins | Bins with >0 counts | Bins with >2000 counts | High rate bins dominated by noise | Noise dominated (total time) | Noise dominated (detector-on time) | Marked lightcurve |
|---|---|---|---|---|---|---|---|
| A | 81502 | 70132 | 4 | 4 | 0.00% | 0.01% | 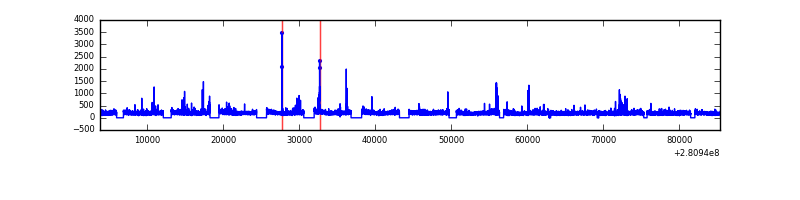 |
| B | 81502 | 70128 | 4 | 4 | 0.00% | 0.01% |  |
| C | 81502 | 70131 | 29 | 29 | 0.04% | 0.04% |  |
| D | 81502 | 70132 | 215 | 215 | 0.26% | 0.31% |  |
Top three noisy pixels from each quadrant. If the there are fewer than three noisy pixels in the level2.evt file, extra rows are filled as -1
| Pixel properties | Quadrant properties | ||||||
|---|---|---|---|---|---|---|---|
| Quadrant | DetID | PixID | Counts | Sigma | Mean | Median | Sigma |
| A | 4 | 2 | 228607 | 283.66 | 3618 | 3544 | 793.4 |
| A | 12 | 189 | 47184 | 55.0 | 3618 | 3544 | 793.4 |
| A | 0 | 226 | 23988 | 25.77 | 3618 | 3544 | 793.4 |
| B | 3 | 209 | 292465 | 420.75 | 3661 | 3572 | 686.6 |
| B | 0 | 197 | 249109 | 357.61 | 3661 | 3572 | 686.6 |
| B | 0 | 219 | 170441 | 243.03 | 3661 | 3572 | 686.6 |
| C | 3 | 233 | 2642192 | 3217.23 | 3499 | 3479 | 820.2 |
| C | 9 | 160 | 105671 | 124.6 | 3499 | 3479 | 820.2 |
| C | 9 | 176 | 80743 | 94.2 | 3499 | 3479 | 820.2 |
| D | 5 | 222 | 4225531 | 5166.29 | 3531 | 3405 | 817.2 |
| D | 12 | 32 | 647803 | 788.5 | 3531 | 3405 | 817.2 |
| D | 10 | 70 | 525583 | 638.95 | 3531 | 3405 | 817.2 |
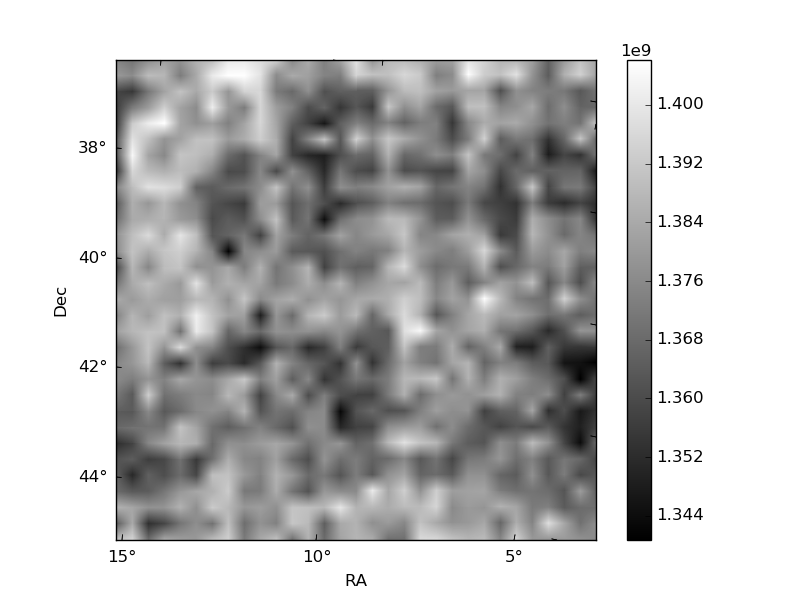
Histogram calculated using DETX and DETY for each event in the final _common_clean file
| Quadrant A |  |
 |
Quadrant B |
|---|---|---|---|
| Quadrant D |  |
 |
Quadrant C |
| Plot type | Count rate plots | Images |
|---|---|---|
| Comparison with Poisson distribution Blue bars denote a histogram of data divided into 1 sec bins. Red curve is a Poisson curve with rate = median count rate of data. |
 |
 |
| Quadrant-wise count rates Data is divided into 100 sec bins |
 |
|
| Module-wise count rates for Quadrant A Data is divided into 100 sec bins |
 |
 |
| Module-wise count rates for Quadrant B Data is divided into 100 sec bins |
 |
 |
| Module-wise count rates for Quadrant C Data is divided into 100 sec bins |
 |
 |
| Module-wise count rates for Quadrant D Data is divided into 100 sec bins |
 |
 |
| Parameter | Plot |
|---|---|
| CZT HV Monitor | 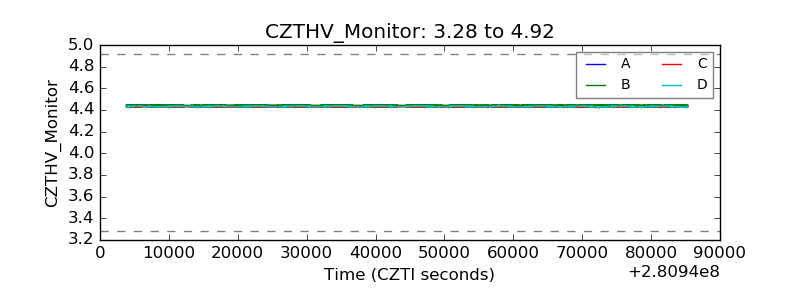 |
| D_VDD |  |
| Temperature 1 |  |
| Veto HV Monitor | 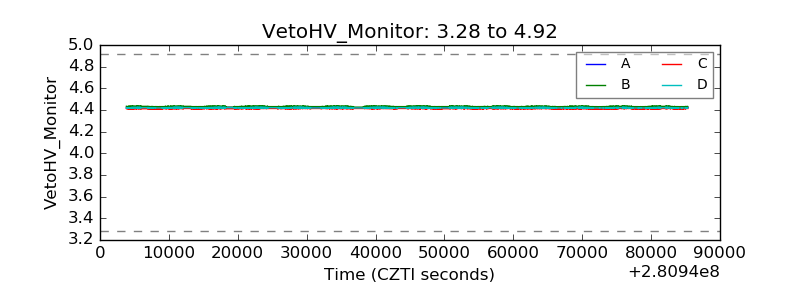 |
| Veto LLD | 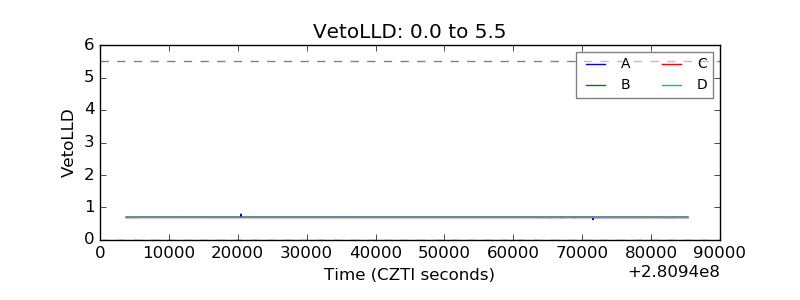 |
| Alpha Counter |  |
| _CPM_Rate |  |
| CZT Counter |  |
| +2.5 Volts monitor | 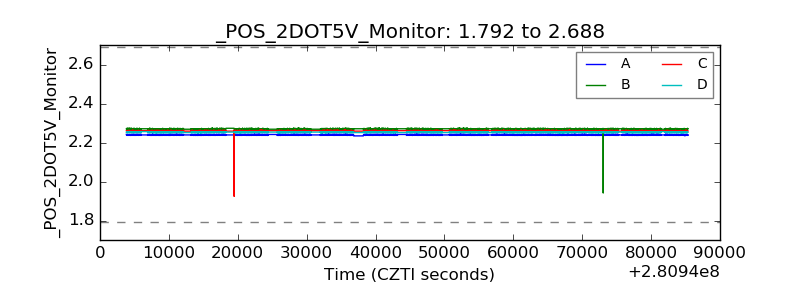 |
| +5 Volts monitor | 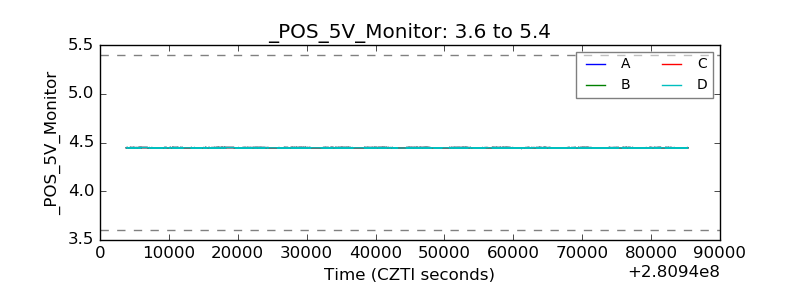 |
| _ROLL_ROT |  |
| _Roll_DEC |  |
| _Roll_RA |  |
| Veto Counter |  |