| Param | Original file | Final file |
|---|---|---|
| Filename | modeM0/AS1A05_004T04_9000002534cztM0_level2_bc.evt | modeM0/AS1A05_004T04_9000002534cztM0_level2_quad_clean.evt |
| Size (bytes) | 2,453,808,960 | 918,403,200 |
| Size | 2.3 GB | 875.9 MB |
| Events in quadrant A | 14,279,264 | 5,869,515 |
| Events in quadrant B | 15,980,883 | 5,943,145 |
| Events in quadrant C | 21,114,243 | 5,630,595 |
| Events in quadrant D | 18,079,622 | 5,486,244 |
| Mode SS | |||
|---|---|---|---|
| Quadrant | BADHDUFLAG | Total packets | Discarded packets |
| A | 0 | 1454 | 0 |
| B | 0 | 1454 | 0 |
| C | 0 | 1454 | 0 |
| D | 0 | 1454 | 0 |
| Mode M9 | |||
|---|---|---|---|
| Quadrant | BADHDUFLAG | Total packets | Discarded packets |
| A | 0 | 110 | 0 |
| B | 0 | 110 | 0 |
| C | 0 | 110 | 0 |
| D | 0 | 110 | 0 |
| Mode M0 | |||
|---|---|---|---|
| Quadrant | BADHDUFLAG | Total packets | Discarded packets |
| A | 0 | 146524 | 0 |
| B | 0 | 152067 | 0 |
| C | 0 | 171569 | 0 |
| D | 0 | 160877 | 0 |
| Quadrant | Total seconds | Saturated seconds | Saturation percentage |
|---|---|---|---|
| A | 71286 | 943 | 1.322840% |
| B | 71286 | 1129 | 1.583761% |
| C | 71286 | 1459 | 2.046685% |
| D | 71286 | 1725 | 2.419830% |
Noise dominated data is calculated using 1-second bins in cleaned event files. If a bin has >2000 counts, and if more than 50% of those come from <1% of pixels, then it is considered to be noise-dominated and hence unusable.
| Quadrant | # 1 sec bins | Bins with >0 counts | Bins with >2000 counts | High rate bins dominated by noise | Noise dominated (total time) | Noise dominated (detector-on time) | Marked lightcurve |
|---|---|---|---|---|---|---|---|
| A | 82331 | 71286 | 1 | 1 | 0.00% | 0.00% |  |
| B | 82331 | 71282 | 2 | 2 | 0.00% | 0.00% |  |
| C | 82331 | 71285 | 4 | 4 | 0.00% | 0.01% |  |
| D | 82331 | 71284 | 80 | 80 | 0.10% | 0.11% |  |
Top three noisy pixels from each quadrant. If the there are fewer than three noisy pixels in the level2.evt file, extra rows are filled as -1
| Pixel properties | Quadrant properties | ||||||
|---|---|---|---|---|---|---|---|
| Quadrant | DetID | PixID | Counts | Sigma | Mean | Median | Sigma |
| A | 4 | 2 | 105763 | 128.11 | 3680 | 3614 | 797.3 |
| A | 12 | 189 | 44859 | 51.73 | 3680 | 3614 | 797.3 |
| A | 12 | 194 | 24261 | 25.9 | 3680 | 3614 | 797.3 |
| B | 0 | 189 | 430816 | 612.63 | 3727 | 3632 | 697.3 |
| B | 7 | 220 | 262209 | 370.83 | 3727 | 3632 | 697.3 |
| B | 0 | 219 | 242330 | 342.32 | 3727 | 3632 | 697.3 |
| C | 3 | 233 | 6934485 | 8301.02 | 3552 | 3528 | 835.0 |
| C | 9 | 54 | 348877 | 413.61 | 3552 | 3528 | 835.0 |
| C | 7 | 247 | 121767 | 141.61 | 3552 | 3528 | 835.0 |
| D | 5 | 222 | 2002852 | 2418.27 | 3600 | 3476 | 826.8 |
| D | 10 | 70 | 1003121 | 1209.08 | 3600 | 3476 | 826.8 |
| D | 1 | 52 | 539243 | 648.02 | 3600 | 3476 | 826.8 |
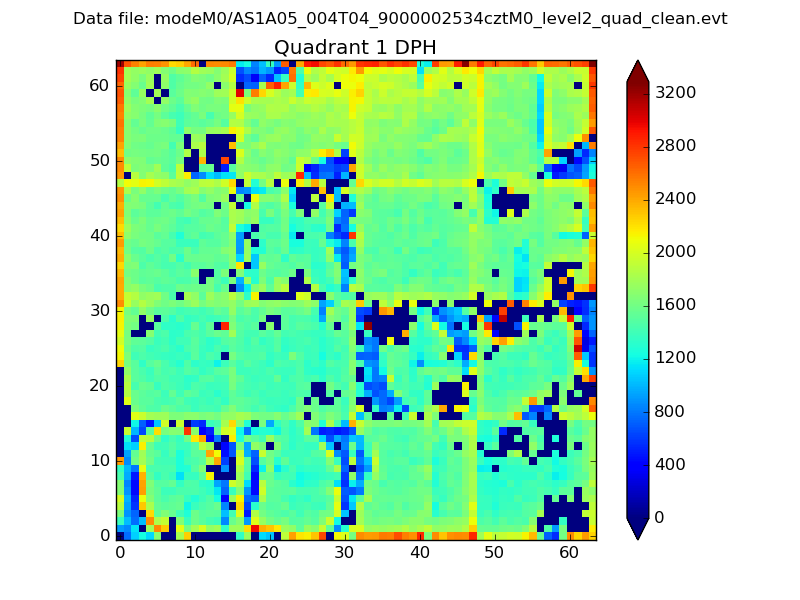
Histogram calculated using DETX and DETY for each event in the final _common_clean file
| Quadrant A |  |
 |
Quadrant B |
|---|---|---|---|
| Quadrant D |  |
 |
Quadrant C |
| Plot type | Count rate plots | Images |
|---|---|---|
| Comparison with Poisson distribution Blue bars denote a histogram of data divided into 1 sec bins. Red curve is a Poisson curve with rate = median count rate of data. |
 |
 |
| Quadrant-wise count rates Data is divided into 100 sec bins |
 |
|
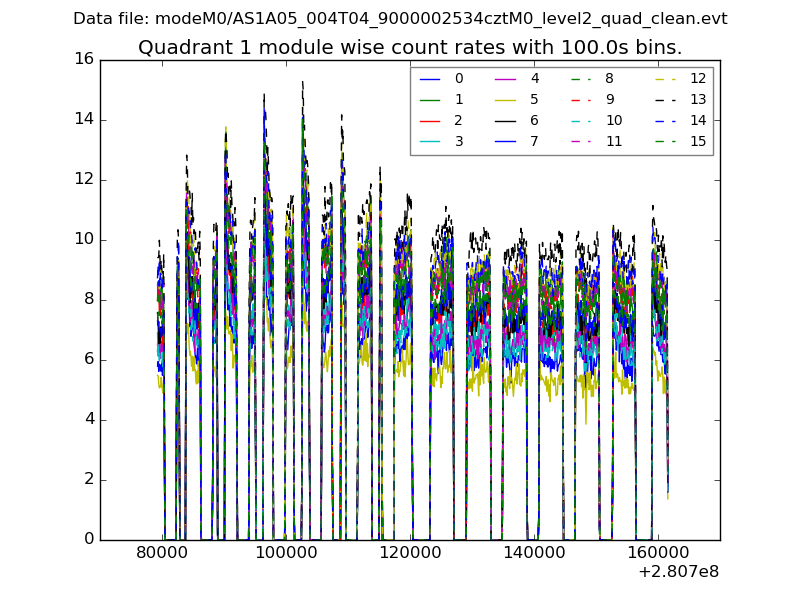
| Module-wise count rates for Quadrant A Data is divided into 100 sec bins |
 |
 |
| Module-wise count rates for Quadrant B Data is divided into 100 sec bins |
 |
 |
| Module-wise count rates for Quadrant C Data is divided into 100 sec bins |
 |
 |
| Module-wise count rates for Quadrant D Data is divided into 100 sec bins |
 |
 |
| Parameter | Plot |
|---|---|
| CZT HV Monitor |  |
| D_VDD |  |
| Temperature 1 | 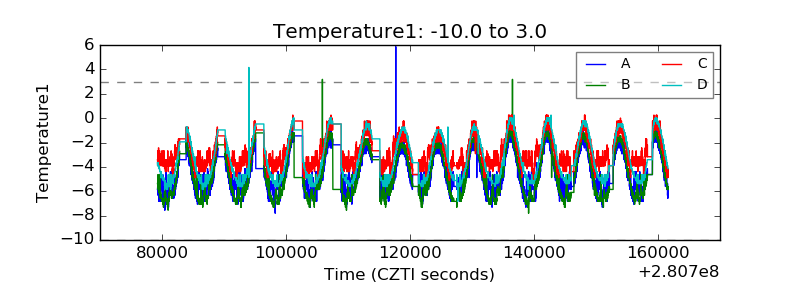 |
| Veto HV Monitor |  |
| Veto LLD |  |
| Alpha Counter |  |
| _CPM_Rate |  |
| CZT Counter |  |
| +2.5 Volts monitor |  |
| +5 Volts monitor |  |
| _ROLL_ROT |  |
| _Roll_DEC |  |
| _Roll_RA |  |
| Veto Counter |  |