| Param | Original file | Final file |
|---|---|---|
| Filename | modeM0/AS1T03_038T01_9000002530cztM0_level2_bc.evt | modeM0/AS1T03_038T01_9000002530cztM0_level2_quad_clean.evt |
| Size (bytes) | 3,767,829,120 | 1,562,685,120 |
| Size | 3.5 GB | 1.5 GB |
| Events in quadrant A | 21,674,299 | 10,284,670 |
| Events in quadrant B | 22,489,260 | 10,477,194 |
| Events in quadrant C | 32,674,828 | 9,900,608 |
| Events in quadrant D | 30,347,576 | 9,705,032 |
| Mode M9 | |||
|---|---|---|---|
| Quadrant | BADHDUFLAG | Total packets | Discarded packets |
| A | 0 | 148 | 0 |
| B | 0 | 148 | 0 |
| C | 0 | 148 | 0 |
| D | 0 | 148 | 0 |
| Mode M0 | |||
|---|---|---|---|
| Quadrant | BADHDUFLAG | Total packets | Discarded packets |
| A | 0 | 214001 | 0 |
| B | 0 | 215159 | 0 |
| C | 0 | 254723 | 0 |
| D | 0 | 242923 | 0 |
| Mode SS | |||
|---|---|---|---|
| Quadrant | BADHDUFLAG | Total packets | Discarded packets |
| A | 0 | 2080 | 0 |
| B | 0 | 2080 | 0 |
| C | 0 | 2080 | 0 |
| D | 0 | 2080 | 0 |
| Quadrant | Total seconds | Saturated seconds | Saturation percentage |
|---|---|---|---|
| A | 101654 | 1300 | 1.278848% |
| B | 101654 | 1318 | 1.296555% |
| C | 101654 | 2669 | 2.625573% |
| D | 101654 | 3423 | 3.367305% |
Noise dominated data is calculated using 1-second bins in cleaned event files. If a bin has >2000 counts, and if more than 50% of those come from <1% of pixels, then it is considered to be noise-dominated and hence unusable.
| Quadrant | # 1 sec bins | Bins with >0 counts | Bins with >2000 counts | High rate bins dominated by noise | Noise dominated (total time) | Noise dominated (detector-on time) | Marked lightcurve |
|---|---|---|---|---|---|---|---|
| A | 116619 | 101663 | 78 | 78 | 0.07% | 0.08% |  |
| B | 116619 | 101660 | 25 | 25 | 0.02% | 0.02% |  |
| C | 116619 | 101659 | 4 | 4 | 0.00% | 0.00% |  |
| D | 116619 | 101659 | 434 | 434 | 0.37% | 0.43% |  |
Top three noisy pixels from each quadrant. If the there are fewer than three noisy pixels in the level2.evt file, extra rows are filled as -1
| Pixel properties | Quadrant properties | ||||||
|---|---|---|---|---|---|---|---|
| Quadrant | DetID | PixID | Counts | Sigma | Mean | Median | Sigma |
| A | 15 | 174 | 1231789 | 1079.96 | 5131 | 5035 | 1135.9 |
| A | 4 | 2 | 417980 | 363.53 | 5131 | 5035 | 1135.9 |
| A | 0 | 254 | 234214 | 201.75 | 5131 | 5035 | 1135.9 |
| B | 0 | 229 | 732562 | 743.59 | 5197 | 5062 | 978.4 |
| B | 3 | 64 | 499281 | 505.15 | 5197 | 5062 | 978.4 |
| B | 0 | 189 | 265959 | 266.67 | 5197 | 5062 | 978.4 |
| C | 3 | 233 | 13261215 | 11424.83 | 4922 | 4890 | 1160.3 |
| C | 7 | 247 | 277648 | 235.07 | 4922 | 4890 | 1160.3 |
| C | 9 | 160 | 83281 | 67.56 | 4922 | 4890 | 1160.3 |
| D | 1 | 52 | 7336712 | 6221.55 | 5008 | 4827 | 1178.5 |
| D | 5 | 222 | 1306119 | 1104.22 | 5008 | 4827 | 1178.5 |
| D | 10 | 70 | 1204692 | 1018.16 | 5008 | 4827 | 1178.5 |
Histogram calculated using DETX and DETY for each event in the final _common_clean file
| Quadrant A | 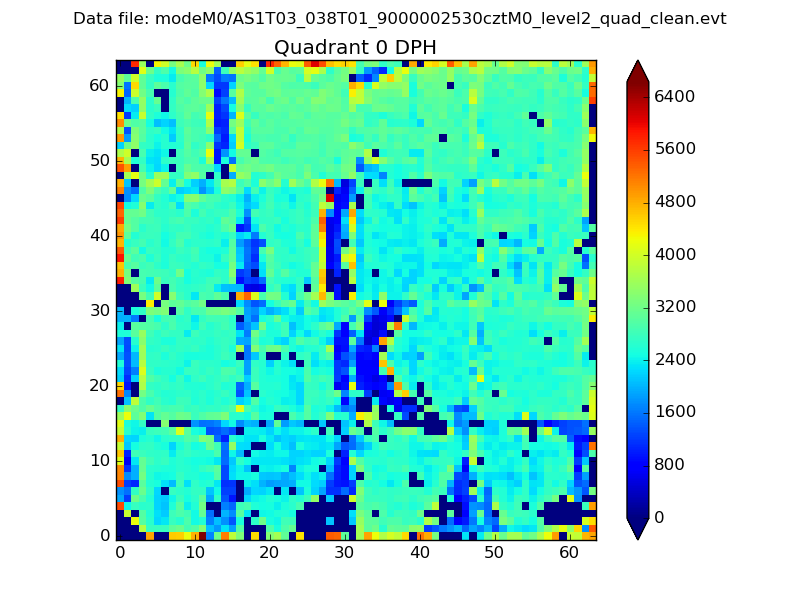 |
 |
Quadrant B |
|---|---|---|---|
| Quadrant D |  |
 |
Quadrant C |
| Plot type | Count rate plots | Images |
|---|---|---|
| Comparison with Poisson distribution Blue bars denote a histogram of data divided into 1 sec bins. Red curve is a Poisson curve with rate = median count rate of data. |
 |
 |
| Quadrant-wise count rates Data is divided into 100 sec bins |
 |
|
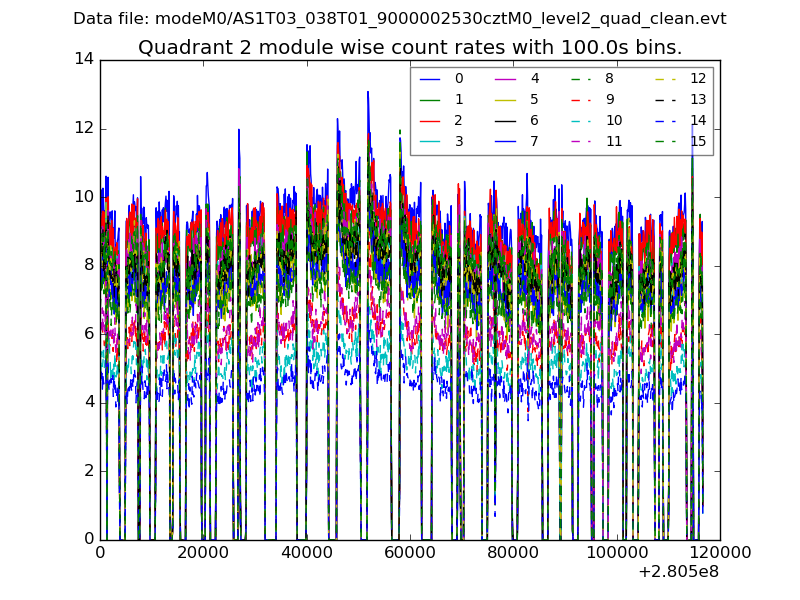
| Module-wise count rates for Quadrant A Data is divided into 100 sec bins |
 |
 |
| Module-wise count rates for Quadrant B Data is divided into 100 sec bins |
 |
 |
| Module-wise count rates for Quadrant C Data is divided into 100 sec bins |
 |
 |
| Module-wise count rates for Quadrant D Data is divided into 100 sec bins |
 |
 |
| Parameter | Plot |
|---|---|
| CZT HV Monitor | 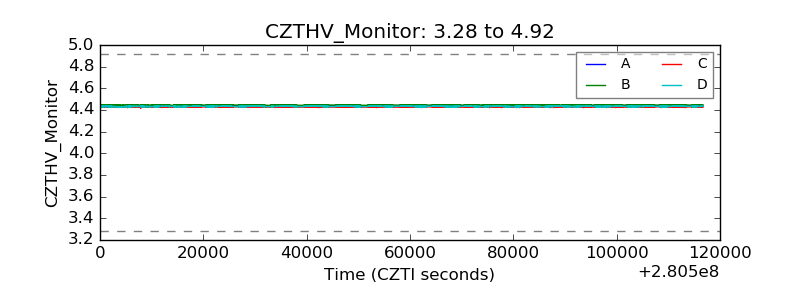 |
| D_VDD |  |
| Temperature 1 |  |
| Veto HV Monitor |  |
| Veto LLD |  |
| Alpha Counter |  |
| _CPM_Rate |  |
| CZT Counter | 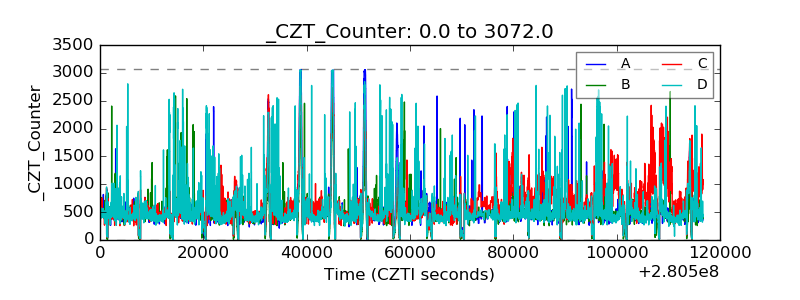 |
| +2.5 Volts monitor | 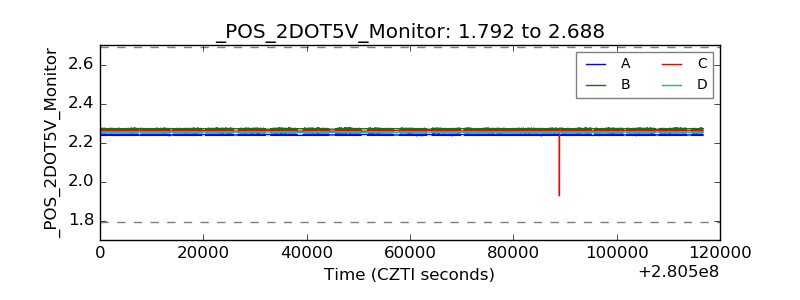 |
| +5 Volts monitor | 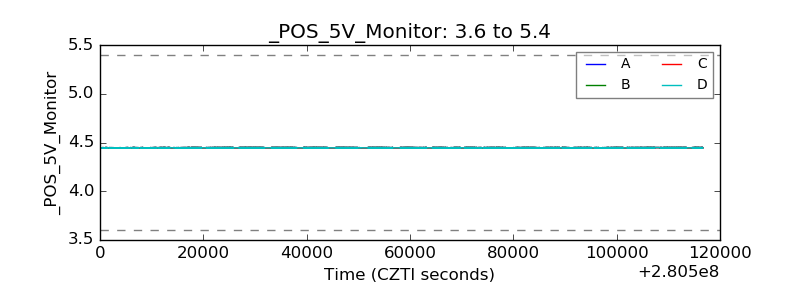 |
| _ROLL_ROT |  |
| _Roll_DEC |  |
| _Roll_RA | 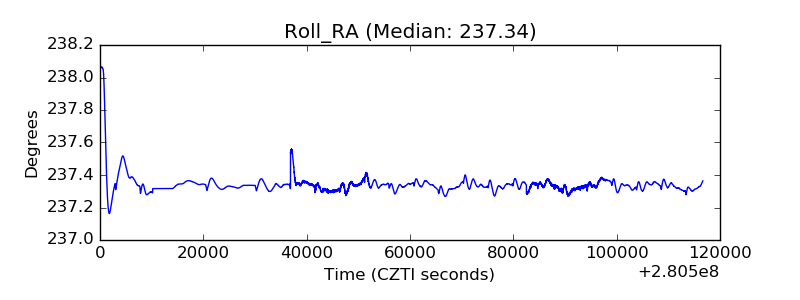 |
| Veto Counter |  |