| Param | Original file | Final file |
|---|---|---|
| Filename | modeM0/AS1A05_206T01_9000002528cztM0_level2_bc.evt | modeM0/AS1A05_206T01_9000002528cztM0_level2_quad_clean.evt |
| Size (bytes) | 3,093,549,120 | 1,369,728,000 |
| Size | 2.9 GB | 1.3 GB |
| Events in quadrant A | 20,785,411 | 8,942,785 |
| Events in quadrant B | 23,254,270 | 9,120,532 |
| Events in quadrant C | 18,459,336 | 8,870,299 |
| Events in quadrant D | 25,343,360 | 8,675,588 |
| Mode M0 | |||
|---|---|---|---|
| Quadrant | BADHDUFLAG | Total packets | Discarded packets |
| A | 0 | 190208 | 0 |
| B | 0 | 198256 | 0 |
| C | 0 | 180231 | 0 |
| D | 0 | 200716 | 0 |
| Mode SS | |||
|---|---|---|---|
| Quadrant | BADHDUFLAG | Total packets | Discarded packets |
| A | 0 | 1744 | 0 |
| B | 0 | 1744 | 0 |
| C | 0 | 1744 | 0 |
| D | 0 | 1744 | 0 |
| Mode M9 | |||
|---|---|---|---|
| Quadrant | BADHDUFLAG | Total packets | Discarded packets |
| A | 0 | 122 | 0 |
| B | 0 | 122 | 0 |
| C | 0 | 122 | 0 |
| D | 0 | 122 | 0 |
| Quadrant | Total seconds | Saturated seconds | Saturation percentage |
|---|---|---|---|
| A | 85792 | 2523 | 2.940834% |
| B | 85792 | 2868 | 3.342969% |
| C | 85792 | 1668 | 1.944237% |
| D | 85792 | 2270 | 2.645934% |
Noise dominated data is calculated using 1-second bins in cleaned event files. If a bin has >2000 counts, and if more than 50% of those come from <1% of pixels, then it is considered to be noise-dominated and hence unusable.
| Quadrant | # 1 sec bins | Bins with >0 counts | Bins with >2000 counts | High rate bins dominated by noise | Noise dominated (total time) | Noise dominated (detector-on time) | Marked lightcurve |
|---|---|---|---|---|---|---|---|
| A | 97432 | 85795 | 269 | 269 | 0.28% | 0.31% |  |
| B | 97432 | 85793 | 202 | 202 | 0.21% | 0.24% | 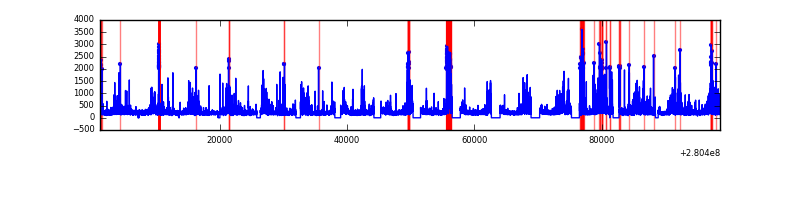 |
| C | 97432 | 85790 | 1 | 1 | 0.00% | 0.00% |  |
| D | 97432 | 85793 | 333 | 333 | 0.34% | 0.39% |  |
Top three noisy pixels from each quadrant. If the there are fewer than three noisy pixels in the level2.evt file, extra rows are filled as -1
| Pixel properties | Quadrant properties | ||||||
|---|---|---|---|---|---|---|---|
| Quadrant | DetID | PixID | Counts | Sigma | Mean | Median | Sigma |
| A | 15 | 174 | 3634751 | 3815.39 | 4359 | 4273 | 951.5 |
| A | 12 | 189 | 244024 | 251.96 | 4359 | 4273 | 951.5 |
| A | 4 | 2 | 158006 | 161.56 | 4359 | 4273 | 951.5 |
| B | 3 | 64 | 1991972 | 2402.46 | 4430 | 4320 | 827.3 |
| B | 7 | 220 | 1189312 | 1432.29 | 4430 | 4320 | 827.3 |
| B | 0 | 219 | 477315 | 571.71 | 4430 | 4320 | 827.3 |
| C | 3 | 233 | 1646917 | 1624.34 | 4312 | 4292 | 1011.3 |
| C | 7 | 247 | 88389 | 83.16 | 4312 | 4292 | 1011.3 |
| C | 0 | 207 | 43362 | 38.64 | 4312 | 4292 | 1011.3 |
| D | 1 | 52 | 6156528 | 5902.59 | 4385 | 4226 | 1042.3 |
| D | 15 | 0 | 628863 | 599.28 | 4385 | 4226 | 1042.3 |
| D | 5 | 222 | 534219 | 508.48 | 4385 | 4226 | 1042.3 |
Histogram calculated using DETX and DETY for each event in the final _common_clean file
| Quadrant A |  |
 |
Quadrant B |
|---|---|---|---|
| Quadrant D |  |
 |
Quadrant C |
| Plot type | Count rate plots | Images |
|---|---|---|
| Comparison with Poisson distribution Blue bars denote a histogram of data divided into 1 sec bins. Red curve is a Poisson curve with rate = median count rate of data. |
 |
 |
| Quadrant-wise count rates Data is divided into 100 sec bins |
 |
|
| Module-wise count rates for Quadrant A Data is divided into 100 sec bins |
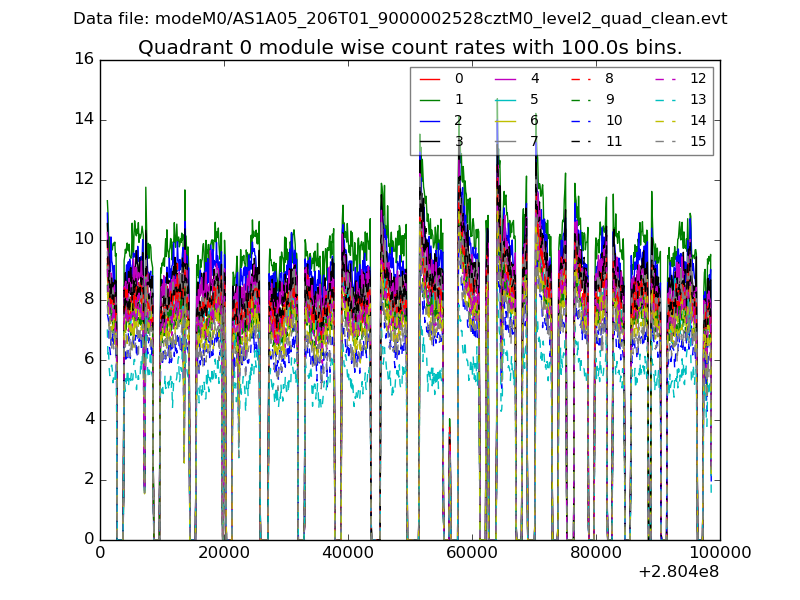 |
 |
| Module-wise count rates for Quadrant B Data is divided into 100 sec bins |
 |
 |
| Module-wise count rates for Quadrant C Data is divided into 100 sec bins |
 |
 |
| Module-wise count rates for Quadrant D Data is divided into 100 sec bins |
 |
 |
| Parameter | Plot |
|---|---|
| CZT HV Monitor | 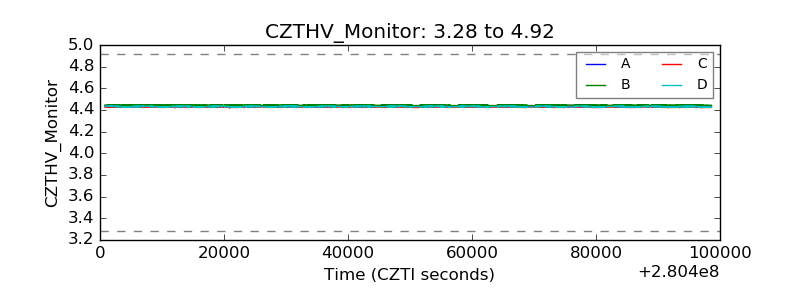 |
| D_VDD | 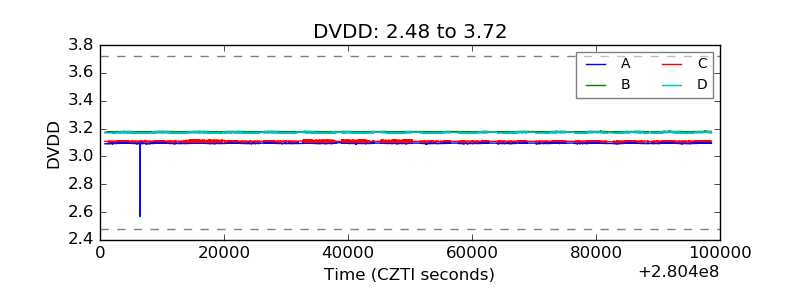 |
| Temperature 1 |  |
| Veto HV Monitor | 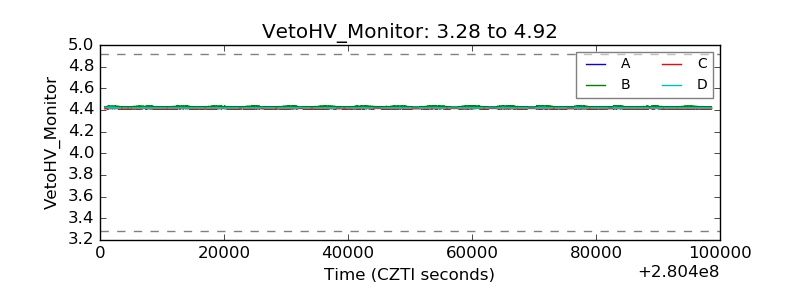 |
| Veto LLD | 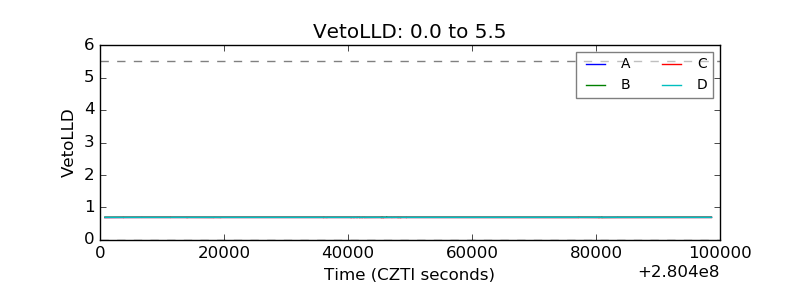 |
| Alpha Counter |  |
| _CPM_Rate |  |
| CZT Counter |  |
| +2.5 Volts monitor |  |
| +5 Volts monitor |  |
| _ROLL_ROT |  |
| _Roll_DEC |  |
| _Roll_RA |  |
| Veto Counter |  |