| Param | Original file | Final file |
|---|---|---|
| Filename | modeM0/AS1A05_206T01_9000002518cztM0_level2_bc.evt | modeM0/AS1A05_206T01_9000002518cztM0_level2_quad_clean.evt |
| Size (bytes) | 3,065,561,280 | 1,223,591,040 |
| Size | 2.9 GB | 1.1 GB |
| Events in quadrant A | 25,134,993 | 7,859,538 |
| Events in quadrant B | 21,011,338 | 8,093,456 |
| Events in quadrant C | 19,090,606 | 7,846,337 |
| Events in quadrant D | 22,042,706 | 7,668,310 |
| Mode M9 | |||
|---|---|---|---|
| Quadrant | BADHDUFLAG | Total packets | Discarded packets |
| A | 0 | 113 | 0 |
| B | 0 | 113 | 0 |
| C | 0 | 113 | 0 |
| D | 0 | 113 | 0 |
| Mode SS | |||
|---|---|---|---|
| Quadrant | BADHDUFLAG | Total packets | Discarded packets |
| A | 0 | 1668 | 0 |
| B | 0 | 1668 | 0 |
| C | 0 | 1668 | 0 |
| D | 0 | 1668 | 0 |
| Mode M0 | |||
|---|---|---|---|
| Quadrant | BADHDUFLAG | Total packets | Discarded packets |
| A | 0 | 206249 | 0 |
| B | 0 | 183999 | 0 |
| C | 0 | 175960 | 0 |
| D | 0 | 183242 | 0 |
| Quadrant | Total seconds | Saturated seconds | Saturation percentage |
|---|---|---|---|
| A | 81602 | 5120 | 6.274356% |
| B | 81603 | 1734 | 2.124922% |
| C | 81603 | 1355 | 1.660478% |
| D | 81603 | 1494 | 1.830815% |
Noise dominated data is calculated using 1-second bins in cleaned event files. If a bin has >2000 counts, and if more than 50% of those come from <1% of pixels, then it is considered to be noise-dominated and hence unusable.
| Quadrant | # 1 sec bins | Bins with >0 counts | Bins with >2000 counts | High rate bins dominated by noise | Noise dominated (total time) | Noise dominated (detector-on time) | Marked lightcurve |
|---|---|---|---|---|---|---|---|
| A | 98452 | 81596 | 425 | 425 | 0.43% | 0.52% |  |
| B | 98452 | 81605 | 76 | 76 | 0.08% | 0.09% |  |
| C | 98452 | 81606 | 2 | 2 | 0.00% | 0.00% | 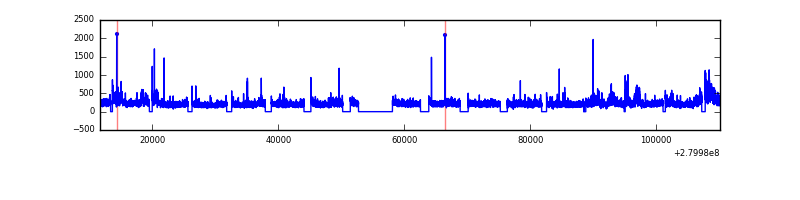 |
| D | 98452 | 81603 | 167 | 167 | 0.17% | 0.20% |  |
Top three noisy pixels from each quadrant. If the there are fewer than three noisy pixels in the level2.evt file, extra rows are filled as -1
| Pixel properties | Quadrant properties | ||||||
|---|---|---|---|---|---|---|---|
| Quadrant | DetID | PixID | Counts | Sigma | Mean | Median | Sigma |
| A | 15 | 174 | 8785858 | 9848.94 | 4067 | 3986 | 891.7 |
| A | 12 | 189 | 562224 | 626.07 | 4067 | 3986 | 891.7 |
| A | 0 | 23 | 74854 | 79.48 | 4067 | 3986 | 891.7 |
| B | 15 | 35 | 1087250 | 1367.34 | 4197 | 4086 | 792.2 |
| B | 3 | 64 | 726544 | 912.0 | 4197 | 4086 | 792.2 |
| B | 0 | 229 | 538829 | 675.04 | 4197 | 4086 | 792.2 |
| C | 3 | 233 | 3318798 | 3452.07 | 4070 | 4050 | 960.2 |
| C | 0 | 207 | 48846 | 46.65 | 4070 | 4050 | 960.2 |
| C | 14 | 225 | 27513 | 24.43 | 4070 | 4050 | 960.2 |
| D | 1 | 52 | 3004444 | 3054.28 | 4159 | 4007 | 982.4 |
| D | 15 | 0 | 847100 | 858.22 | 4159 | 4007 | 982.4 |
| D | 10 | 199 | 526064 | 531.42 | 4159 | 4007 | 982.4 |
Histogram calculated using DETX and DETY for each event in the final _common_clean file
| Quadrant A |  |
 |
Quadrant B |
|---|---|---|---|
| Quadrant D |  |
 |
Quadrant C |
| Plot type | Count rate plots | Images |
|---|---|---|
| Comparison with Poisson distribution Blue bars denote a histogram of data divided into 1 sec bins. Red curve is a Poisson curve with rate = median count rate of data. |
 |
 |
| Quadrant-wise count rates Data is divided into 100 sec bins |
 |
|
| Module-wise count rates for Quadrant A Data is divided into 100 sec bins |
 |
 |
| Module-wise count rates for Quadrant B Data is divided into 100 sec bins |
 |
 |
| Module-wise count rates for Quadrant C Data is divided into 100 sec bins |
 |
 |
| Module-wise count rates for Quadrant D Data is divided into 100 sec bins |
 |
 |
| Parameter | Plot |
|---|---|
| CZT HV Monitor |  |
| D_VDD |  |
| Temperature 1 | 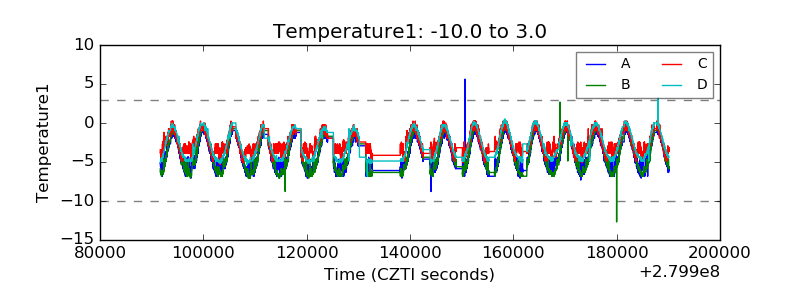 |
| Veto HV Monitor |  |
| Veto LLD |  |
| Alpha Counter |  |
| _CPM_Rate |  |
| CZT Counter |  |
| +2.5 Volts monitor |  |
| +5 Volts monitor |  |
| _ROLL_ROT | 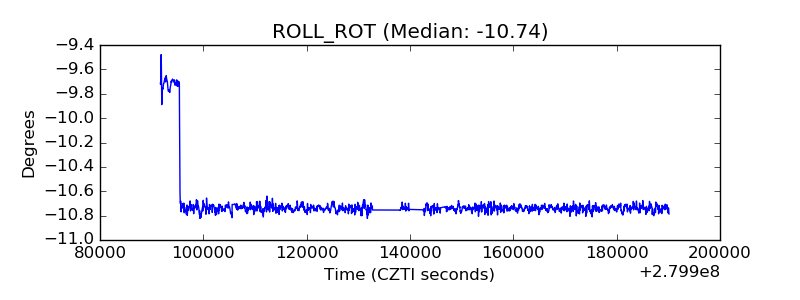 |
| _Roll_DEC |  |
| _Roll_RA | 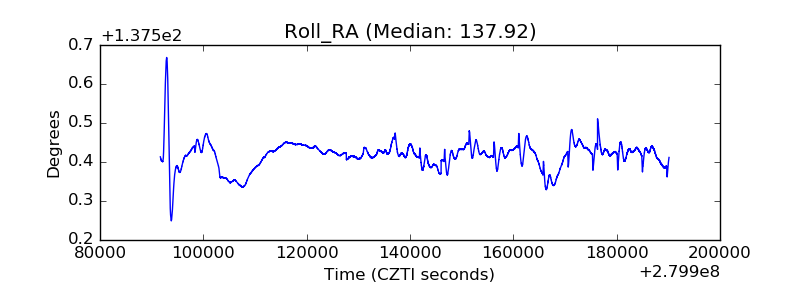 |
| Veto Counter |  |