| Param | Original file | Final file |
|---|---|---|
| Filename | modeM0/AS1T03_013T01_9000002514cztM0_level2_bc.evt | modeM0/AS1T03_013T01_9000002514cztM0_level2_quad_clean.evt |
| Size (bytes) | 2,246,976,000 | 634,008,960 |
| Size | 2.1 GB | 604.6 MB |
| Events in quadrant A | 15,802,197 | 4,128,905 |
| Events in quadrant B | 9,903,683 | 4,284,280 |
| Events in quadrant C | 14,823,002 | 4,068,618 |
| Events in quadrant D | 24,407,610 | 3,583,149 |
| Mode M9 | |||
|---|---|---|---|
| Quadrant | BADHDUFLAG | Total packets | Discarded packets |
| A | 0 | 79 | 0 |
| B | 0 | 79 | 0 |
| C | 0 | 79 | 0 |
| D | 0 | 79 | 0 |
| Mode SS | |||
|---|---|---|---|
| Quadrant | BADHDUFLAG | Total packets | Discarded packets |
| A | 0 | 930 | 0 |
| B | 0 | 930 | 0 |
| C | 0 | 930 | 0 |
| D | 0 | 930 | 0 |
| Mode M0 | |||
|---|---|---|---|
| Quadrant | BADHDUFLAG | Total packets | Discarded packets |
| A | 0 | 120780 | 0 |
| B | 0 | 95303 | 0 |
| C | 0 | 113872 | 0 |
| D | 0 | 167733 | 0 |
| Quadrant | Total seconds | Saturated seconds | Saturation percentage |
|---|---|---|---|
| A | 45698 | 2051 | 4.488161% |
| B | 45699 | 380 | 0.831528% |
| C | 45699 | 1027 | 2.247314% |
| D | 45699 | 8274 | 18.105429% |
Noise dominated data is calculated using 1-second bins in cleaned event files. If a bin has >2000 counts, and if more than 50% of those come from <1% of pixels, then it is considered to be noise-dominated and hence unusable.
| Quadrant | # 1 sec bins | Bins with >0 counts | Bins with >2000 counts | High rate bins dominated by noise | Noise dominated (total time) | Noise dominated (detector-on time) | Marked lightcurve |
|---|---|---|---|---|---|---|---|
| A | 64791 | 45695 | 122 | 122 | 0.19% | 0.27% |  |
| B | 64791 | 45702 | 4 | 4 | 0.01% | 0.01% |  |
| C | 64791 | 45701 | 6 | 6 | 0.01% | 0.01% | 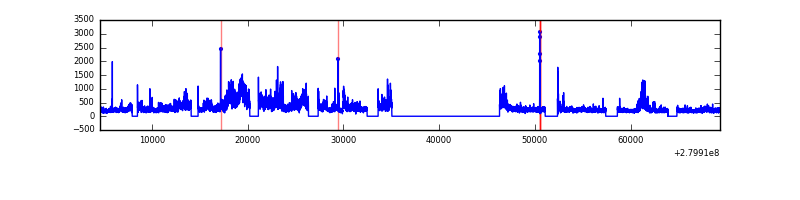 |
| D | 64791 | 45671 | 369 | 369 | 0.57% | 0.81% |  |
Top three noisy pixels from each quadrant. If the there are fewer than three noisy pixels in the level2.evt file, extra rows are filled as -1
| Pixel properties | Quadrant properties | ||||||
|---|---|---|---|---|---|---|---|
| Quadrant | DetID | PixID | Counts | Sigma | Mean | Median | Sigma |
| A | 15 | 174 | 6841941 | 13521.55 | 2319 | 2281 | 505.8 |
| A | 0 | 23 | 53735 | 101.72 | 2319 | 2281 | 505.8 |
| A | 0 | 226 | 18006 | 31.09 | 2319 | 2281 | 505.8 |
| B | 15 | 35 | 197469 | 438.67 | 2367 | 2310 | 444.9 |
| B | 0 | 229 | 121311 | 267.49 | 2367 | 2310 | 444.9 |
| B | 0 | 197 | 105432 | 231.79 | 2367 | 2310 | 444.9 |
| C | 3 | 233 | 6065358 | 11494.93 | 2243 | 2231 | 527.5 |
| C | 5 | 112 | 67211 | 123.19 | 2243 | 2231 | 527.5 |
| C | 14 | 225 | 57290 | 104.38 | 2243 | 2231 | 527.5 |
| D | 1 | 52 | 15862814 | 33147.88 | 2065 | 1996 | 478.5 |
| D | 2 | 152 | 272341 | 565.0 | 2065 | 1996 | 478.5 |
| D | 2 | 234 | 173916 | 359.3 | 2065 | 1996 | 478.5 |
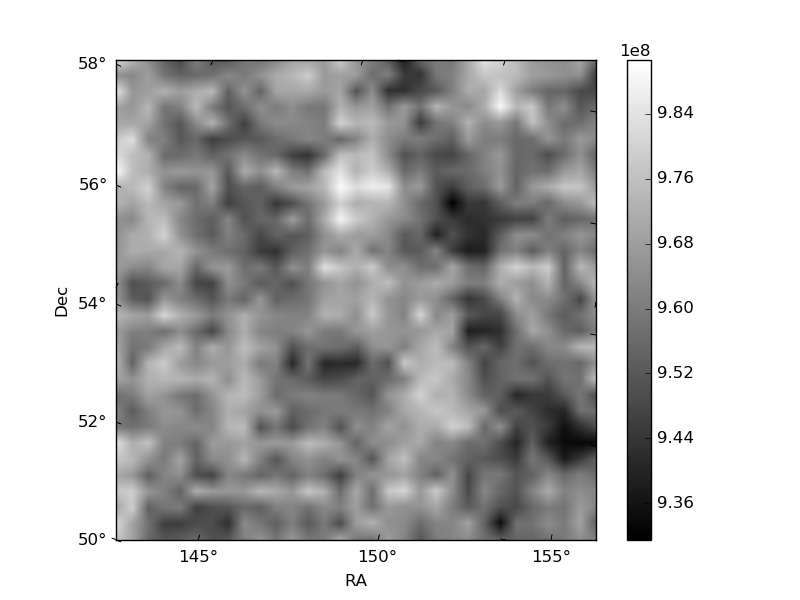
Histogram calculated using DETX and DETY for each event in the final _common_clean file
| Quadrant A |  |
 |
Quadrant B |
|---|---|---|---|
| Quadrant D | 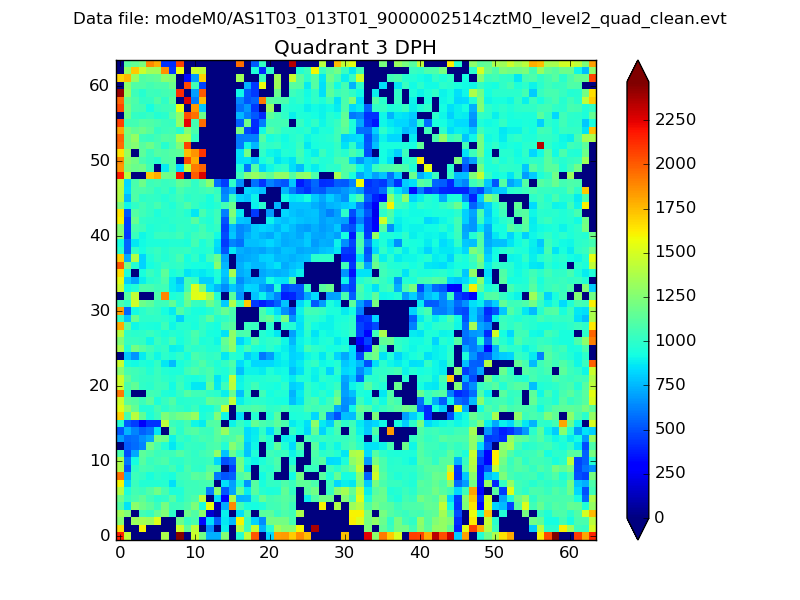 |
 |
Quadrant C |
| Plot type | Count rate plots | Images |
|---|---|---|
| Comparison with Poisson distribution Blue bars denote a histogram of data divided into 1 sec bins. Red curve is a Poisson curve with rate = median count rate of data. |
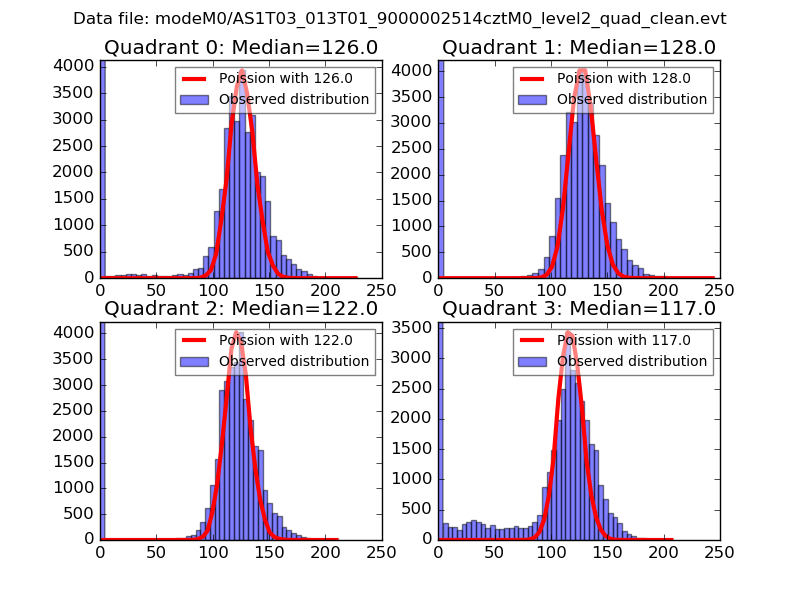 |
 |
| Quadrant-wise count rates Data is divided into 100 sec bins |
 |
|
| Module-wise count rates for Quadrant A Data is divided into 100 sec bins |
 |
 |
| Module-wise count rates for Quadrant B Data is divided into 100 sec bins |
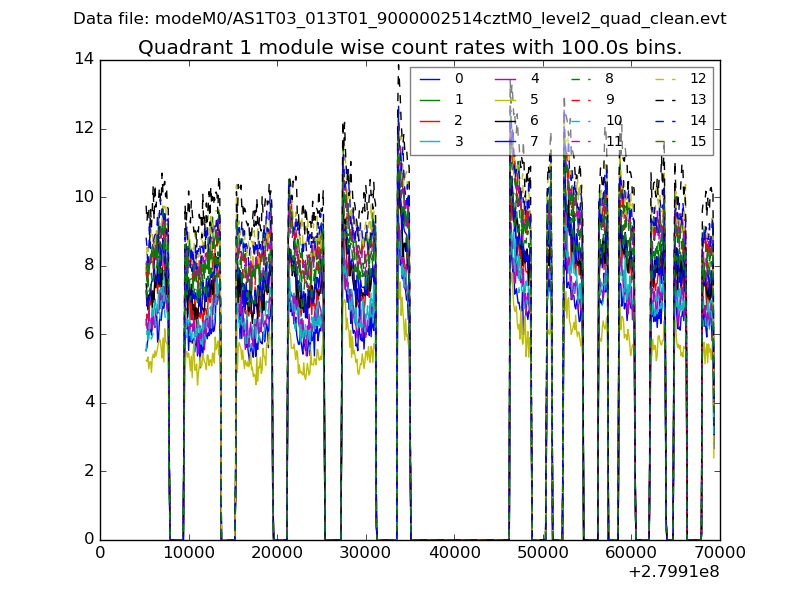 |
 |
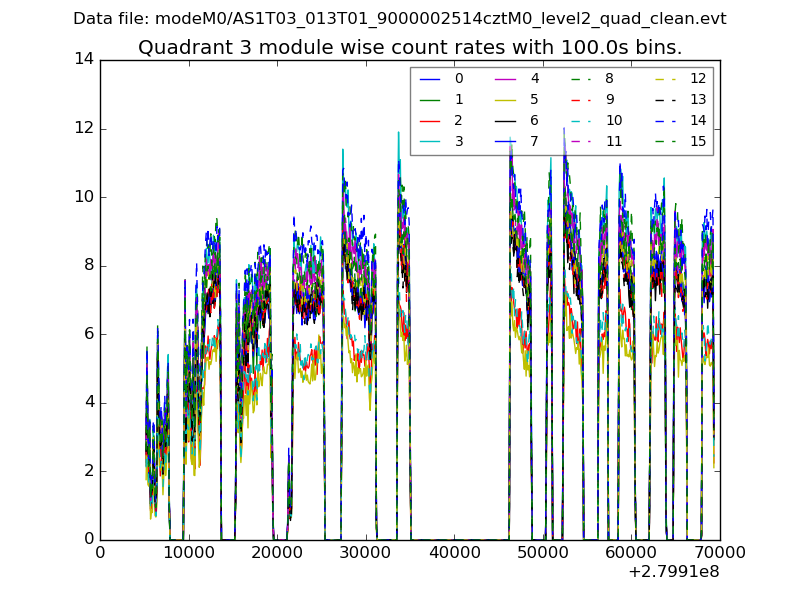
| Module-wise count rates for Quadrant C Data is divided into 100 sec bins |
 |
 |
| Module-wise count rates for Quadrant D Data is divided into 100 sec bins |
 |
 |
| Parameter | Plot |
|---|---|
| CZT HV Monitor | 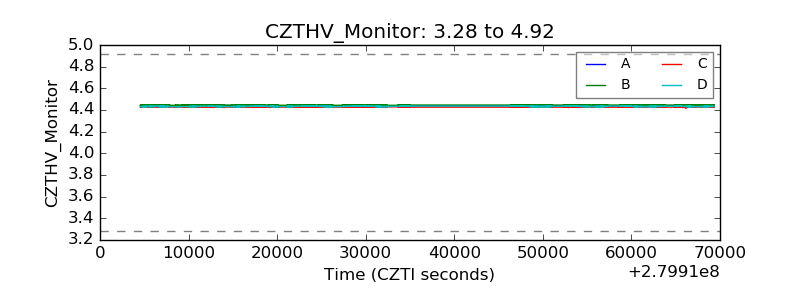 |
| D_VDD |  |
| Temperature 1 |  |
| Veto HV Monitor | 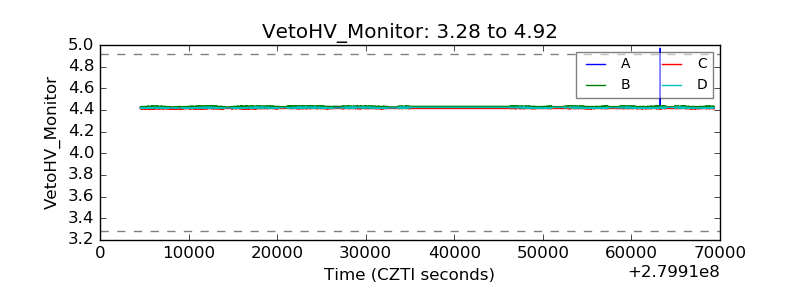 |
| Veto LLD | 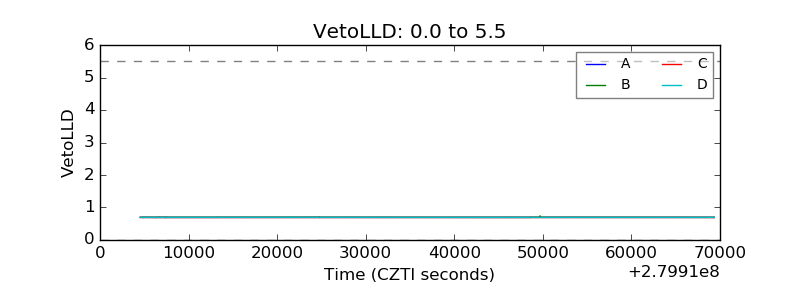 |
| Alpha Counter |  |
| _CPM_Rate |  |
| CZT Counter |  |
| +2.5 Volts monitor |  |
| +5 Volts monitor |  |
| _ROLL_ROT |  |
| _Roll_DEC |  |
| _Roll_RA |  |
| Veto Counter |  |