| Param | Original file | Final file |
|---|---|---|
| Filename | modeM0/AS1T03_030T01_9000002512cztM0_level2_bc.evt | modeM0/AS1T03_030T01_9000002512cztM0_level2_quad_clean.evt |
| Size (bytes) | 4,028,232,960 | 1,034,458,560 |
| Size | 3.8 GB | 986.5 MB |
| Events in quadrant A | 47,941,136 | 6,072,017 |
| Events in quadrant B | 19,899,001 | 6,856,692 |
| Events in quadrant C | 18,003,737 | 6,535,931 |
| Events in quadrant D | 30,456,073 | 6,131,359 |
| Mode SS | |||
|---|---|---|---|
| Quadrant | BADHDUFLAG | Total packets | Discarded packets |
| A | 0 | 1706 | 0 |
| B | 0 | 1706 | 0 |
| C | 0 | 1706 | 0 |
| D | 0 | 1706 | 0 |
| Mode M9 | |||
|---|---|---|---|
| Quadrant | BADHDUFLAG | Total packets | Discarded packets |
| A | 0 | 118 | 0 |
| B | 0 | 118 | 0 |
| C | 0 | 118 | 0 |
| D | 0 | 118 | 0 |
| Mode M0 | |||
|---|---|---|---|
| Quadrant | BADHDUFLAG | Total packets | Discarded packets |
| A | 0 | 326680 | 0 |
| B | 0 | 182967 | 0 |
| C | 0 | 176855 | 0 |
| D | 0 | 226637 | 0 |
| Quadrant | Total seconds | Saturated seconds | Saturation percentage |
|---|---|---|---|
| A | 83573 | 19326 | 23.124693% |
| B | 83573 | 1826 | 2.184916% |
| C | 83574 | 1382 | 1.653624% |
| D | 83574 | 5555 | 6.646804% |
Noise dominated data is calculated using 1-second bins in cleaned event files. If a bin has >2000 counts, and if more than 50% of those come from <1% of pixels, then it is considered to be noise-dominated and hence unusable.
| Quadrant | # 1 sec bins | Bins with >0 counts | Bins with >2000 counts | High rate bins dominated by noise | Noise dominated (total time) | Noise dominated (detector-on time) | Marked lightcurve |
|---|---|---|---|---|---|---|---|
| A | 95464 | 83561 | 263 | 263 | 0.28% | 0.31% |  |
| B | 95464 | 83575 | 41 | 41 | 0.04% | 0.05% |  |
| C | 95465 | 83577 | 0 | 0 | 0.00% | 0.00% |  |
| D | 95464 | 83561 | 605 | 605 | 0.63% | 0.72% |  |
Top three noisy pixels from each quadrant. If the there are fewer than three noisy pixels in the level2.evt file, extra rows are filled as -1
| Pixel properties | Quadrant properties | ||||||
|---|---|---|---|---|---|---|---|
| Quadrant | DetID | PixID | Counts | Sigma | Mean | Median | Sigma |
| A | 15 | 174 | 32315109 | 37672.7 | 3970 | 3906 | 857.7 |
| A | 12 | 189 | 215350 | 246.53 | 3970 | 3906 | 857.7 |
| A | 0 | 23 | 107301 | 120.55 | 3970 | 3906 | 857.7 |
| B | 3 | 64 | 1224537 | 1489.7 | 4409 | 4304 | 819.1 |
| B | 15 | 35 | 696423 | 844.96 | 4409 | 4304 | 819.1 |
| B | 4 | 216 | 243440 | 291.94 | 4409 | 4304 | 819.1 |
| C | 3 | 233 | 1814633 | 1867.39 | 4185 | 4157 | 969.5 |
| C | 5 | 112 | 36574 | 33.44 | 4185 | 4157 | 969.5 |
| C | 13 | 61 | 24597 | 21.08 | 4185 | 4157 | 969.5 |
| D | 1 | 52 | 12612393 | 13179.81 | 4162 | 4017 | 956.6 |
| D | 2 | 152 | 705620 | 733.4 | 4162 | 4017 | 956.6 |
| D | 12 | 235 | 429500 | 444.77 | 4162 | 4017 | 956.6 |
Histogram calculated using DETX and DETY for each event in the final _common_clean file
| Quadrant A | 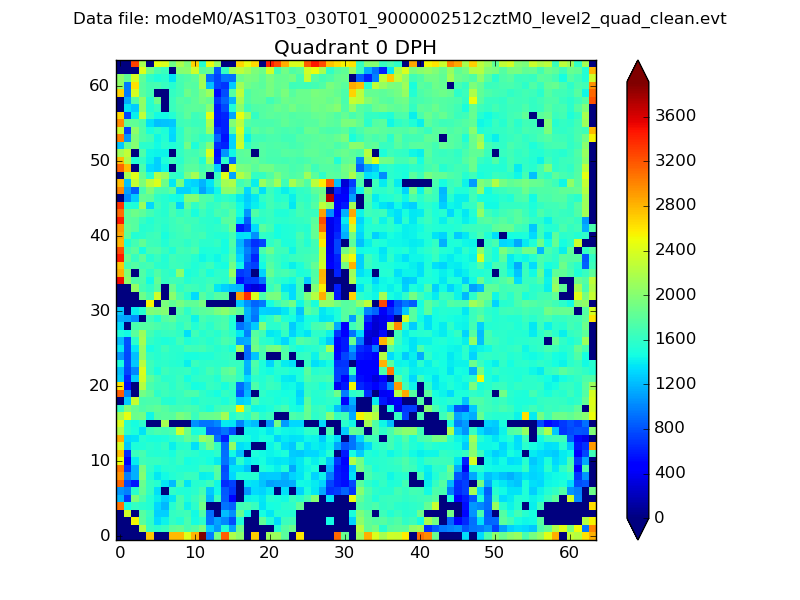 |
 |
Quadrant B |
|---|---|---|---|
| Quadrant D |  |
 |
Quadrant C |
| Plot type | Count rate plots | Images |
|---|---|---|
| Comparison with Poisson distribution Blue bars denote a histogram of data divided into 1 sec bins. Red curve is a Poisson curve with rate = median count rate of data. |
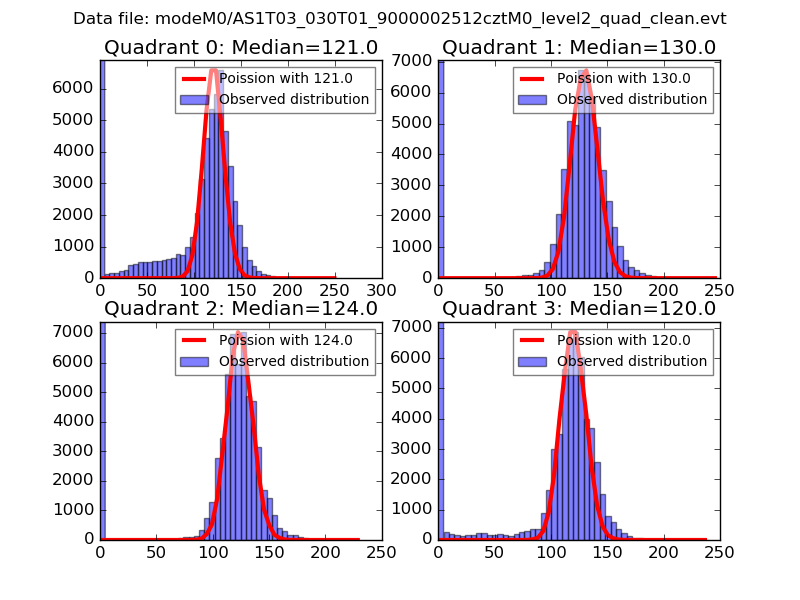 |
 |
| Quadrant-wise count rates Data is divided into 100 sec bins |
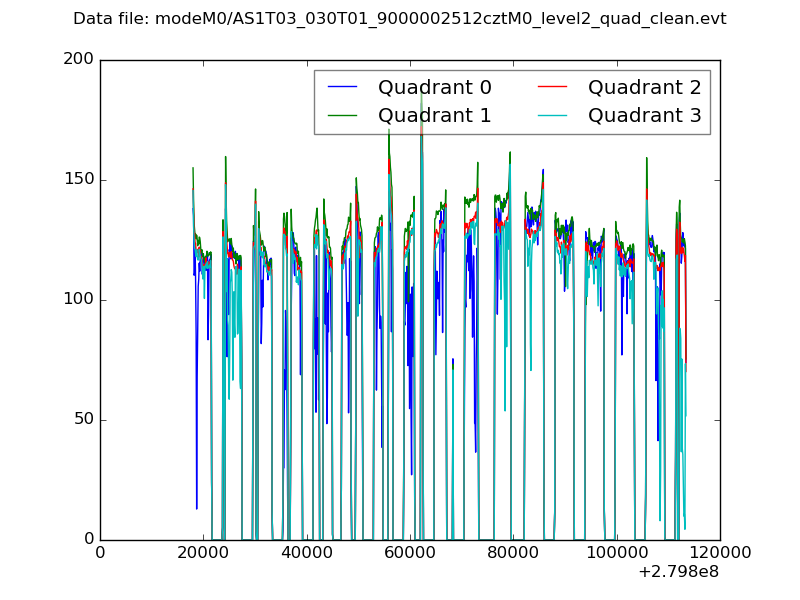 |
|
| Module-wise count rates for Quadrant A Data is divided into 100 sec bins |
 |
 |
| Module-wise count rates for Quadrant B Data is divided into 100 sec bins |
 |
 |
| Module-wise count rates for Quadrant C Data is divided into 100 sec bins |
 |
 |
| Module-wise count rates for Quadrant D Data is divided into 100 sec bins |
 |
 |
| Parameter | Plot |
|---|---|
| CZT HV Monitor |  |
| D_VDD |  |
| Temperature 1 |  |
| Veto HV Monitor |  |
| Veto LLD |  |
| Alpha Counter |  |
| _CPM_Rate |  |
| CZT Counter | 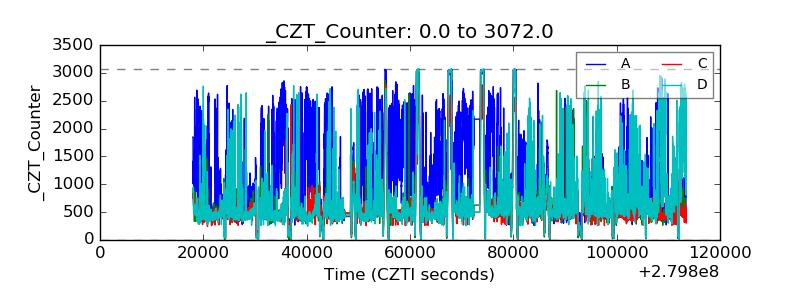 |
| +2.5 Volts monitor |  |
| +5 Volts monitor |  |
| _ROLL_ROT |  |
| _Roll_DEC |  |
| _Roll_RA |  |
| Veto Counter |  |