| Param | Original file | Final file |
|---|---|---|
| Filename | modeM0/AS1A05_225T02_9000002510cztM0_level2_bc.evt | modeM0/AS1A05_225T02_9000002510cztM0_level2_quad_clean.evt |
| Size (bytes) | 226,566,720 | 85,936,320 |
| Size | 216.1 MB | 82.0 MB |
| Events in quadrant A | 3,358,751 | 536,783 |
| Events in quadrant B | 998,708 | 598,905 |
| Events in quadrant C | 940,934 | 573,667 |
| Events in quadrant D | 1,237,244 | 564,662 |
| Mode SS | |||
|---|---|---|---|
| Quadrant | BADHDUFLAG | Total packets | Discarded packets |
| A | 0 | 96 | 0 |
| B | 0 | 96 | 0 |
| C | 0 | 96 | 0 |
| D | 0 | 96 | 0 |
| Mode M9 | |||
|---|---|---|---|
| Quadrant | BADHDUFLAG | Total packets | Discarded packets |
| A | 0 | 6 | 0 |
| B | 0 | 6 | 0 |
| C | 0 | 6 | 0 |
| D | 0 | 6 | 0 |
| Mode M0 | |||
|---|---|---|---|
| Quadrant | BADHDUFLAG | Total packets | Discarded packets |
| A | 0 | 20551 | 0 |
| B | 0 | 9738 | 0 |
| C | 0 | 9550 | 0 |
| D | 0 | 10468 | 0 |
| Quadrant | Total seconds | Saturated seconds | Saturation percentage |
|---|---|---|---|
| A | 4670 | 1008 | 21.584582% |
| B | 4669 | 79 | 1.692011% |
| C | 4669 | 71 | 1.520668% |
| D | 4669 | 81 | 1.734847% |
Noise dominated data is calculated using 1-second bins in cleaned event files. If a bin has >2000 counts, and if more than 50% of those come from <1% of pixels, then it is considered to be noise-dominated and hence unusable.
| Quadrant | # 1 sec bins | Bins with >0 counts | Bins with >2000 counts | High rate bins dominated by noise | Noise dominated (total time) | Noise dominated (detector-on time) | Marked lightcurve |
|---|---|---|---|---|---|---|---|
| A | 5306 | 4669 | 16 | 16 | 0.30% | 0.34% | 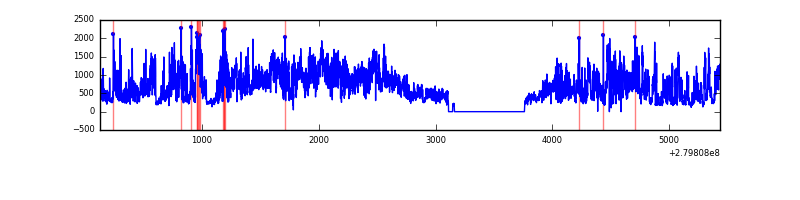 |
| B | 5305 | 4670 | 1 | 1 | 0.02% | 0.02% | 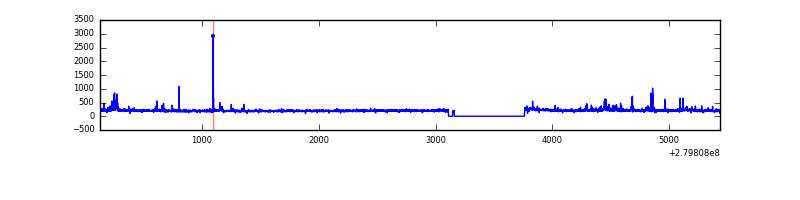 |
| C | 5305 | 4671 | 0 | 0 | 0.00% | 0.00% | 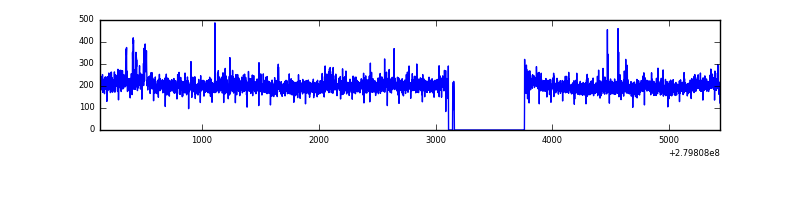 |
| D | 5305 | 4671 | 6 | 6 | 0.11% | 0.13% |  |
Top three noisy pixels from each quadrant. If the there are fewer than three noisy pixels in the level2.evt file, extra rows are filled as -1
| Pixel properties | Quadrant properties | ||||||
|---|---|---|---|---|---|---|---|
| Quadrant | DetID | PixID | Counts | Sigma | Mean | Median | Sigma |
| A | 15 | 174 | 2391852 | 47501.79 | 219 | 215 | 50.3 |
| A | 12 | 189 | 65091 | 1288.54 | 219 | 215 | 50.3 |
| A | 0 | 23 | 49958 | 987.98 | 219 | 215 | 50.3 |
| B | 15 | 35 | 14821 | 301.56 | 238 | 232 | 48.4 |
| B | 0 | 189 | 12554 | 254.7 | 238 | 232 | 48.4 |
| B | 0 | 229 | 11786 | 238.83 | 238 | 232 | 48.4 |
| C | 3 | 233 | 59900 | 1050.93 | 228 | 226 | 56.8 |
| C | 5 | 112 | 1427 | 21.15 | 228 | 226 | 56.8 |
| C | 13 | 61 | 1359 | 19.95 | 228 | 226 | 56.8 |
| D | 1 | 52 | 230823 | 4112.79 | 232 | 223 | 56.1 |
| D | 13 | 112 | 41864 | 742.67 | 232 | 223 | 56.1 |
| D | 15 | 0 | 30894 | 547.02 | 232 | 223 | 56.1 |
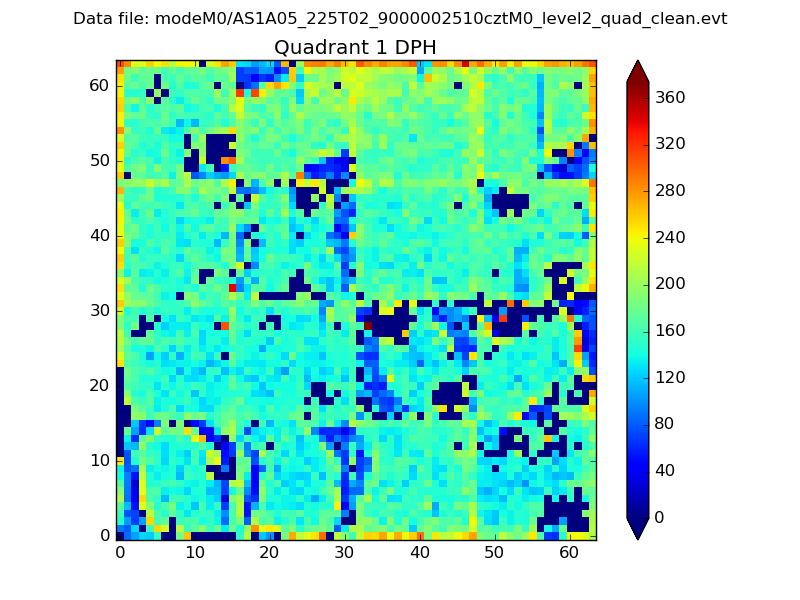
Histogram calculated using DETX and DETY for each event in the final _common_clean file
| Quadrant A |  |
 |
Quadrant B |
|---|---|---|---|
| Quadrant D |  |
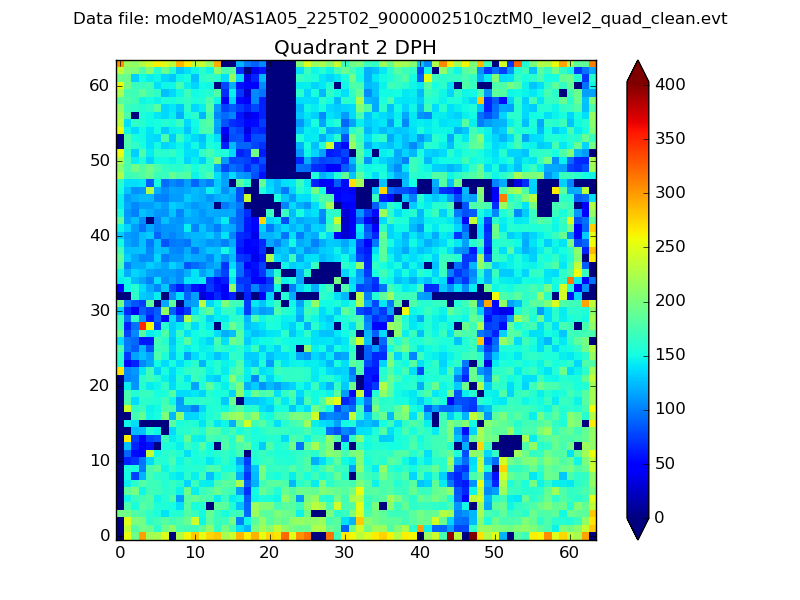 |
Quadrant C |
| Plot type | Count rate plots | Images |
|---|---|---|
| Comparison with Poisson distribution Blue bars denote a histogram of data divided into 1 sec bins. Red curve is a Poisson curve with rate = median count rate of data. |
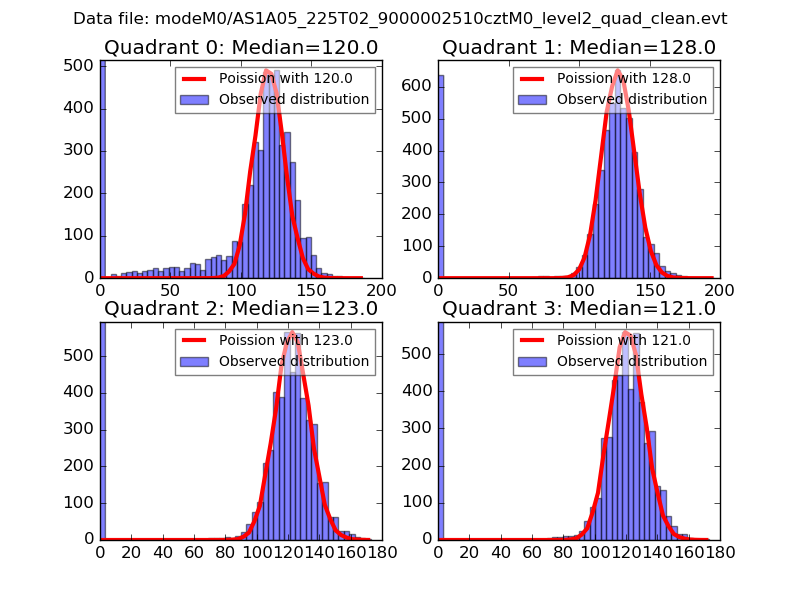 |
 |
| Quadrant-wise count rates Data is divided into 100 sec bins |
 |
|
| Module-wise count rates for Quadrant A Data is divided into 100 sec bins |
 |
 |
| Module-wise count rates for Quadrant B Data is divided into 100 sec bins |
 |
 |
| Module-wise count rates for Quadrant C Data is divided into 100 sec bins |
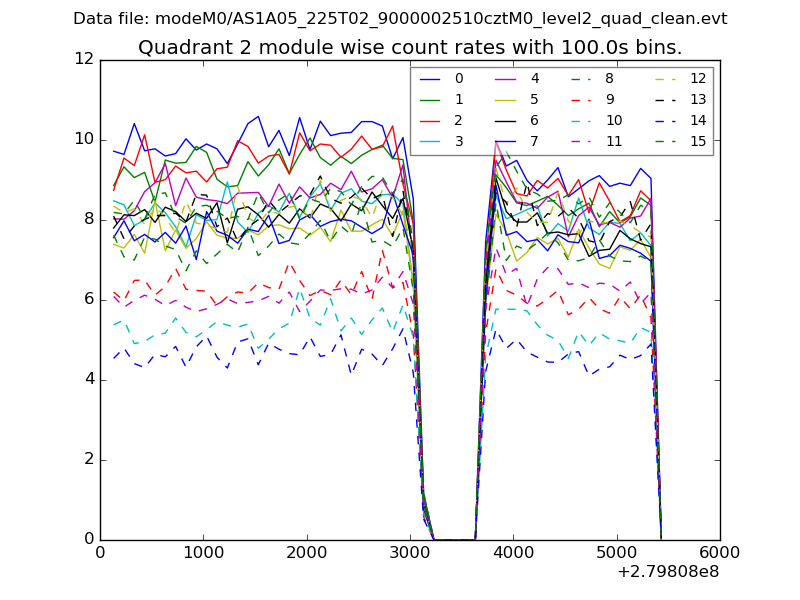 |
 |
| Module-wise count rates for Quadrant D Data is divided into 100 sec bins |
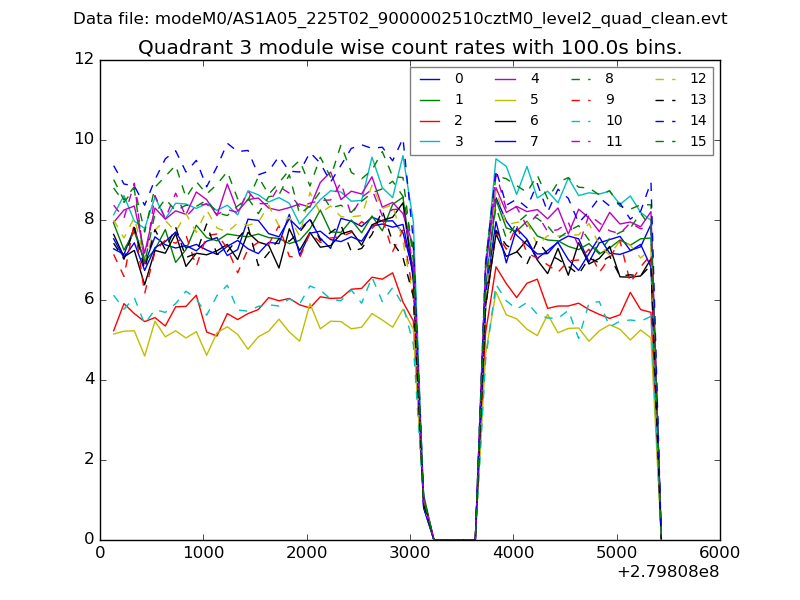 |
 |
| Parameter | Plot |
|---|---|
| CZT HV Monitor |  |
| D_VDD |  |
| Temperature 1 |  |
| Veto HV Monitor |  |
| Veto LLD |  |
| Alpha Counter | 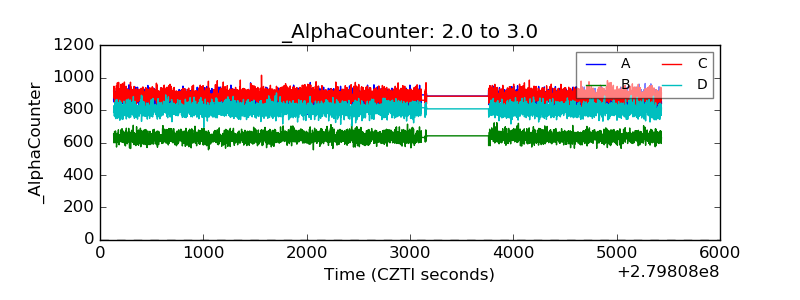 |
| _CPM_Rate |  |
| CZT Counter |  |
| +2.5 Volts monitor |  |
| +5 Volts monitor |  |
| _ROLL_ROT |  |
| _Roll_DEC | 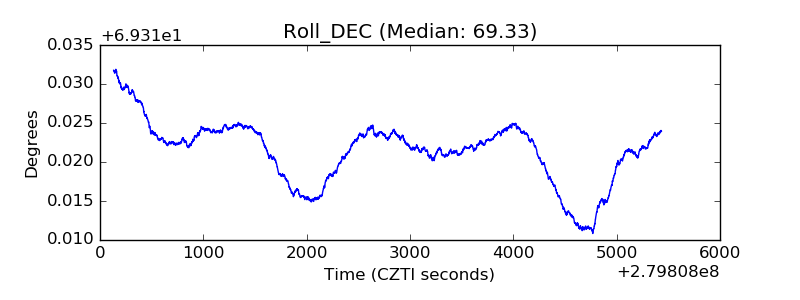 |
| _Roll_RA |  |
| Veto Counter | 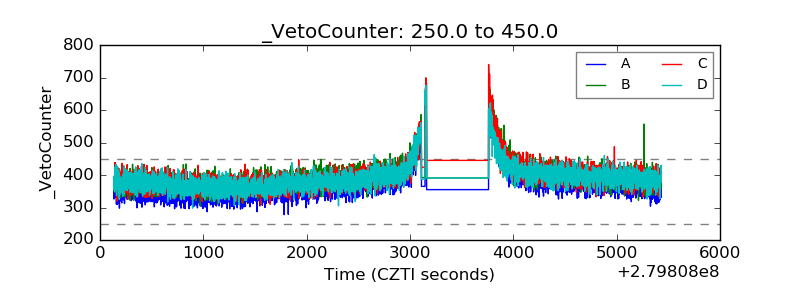 |