| Param | Original file | Final file |
|---|---|---|
| Filename | modeM0/AS1A05_074T02_9000002504cztM0_level2_bc.evt | modeM0/AS1A05_074T02_9000002504cztM0_level2_quad_clean.evt |
| Size (bytes) | 1,199,471,040 | 342,861,120 |
| Size | 1.1 GB | 327.0 MB |
| Events in quadrant A | 6,027,684 | 2,212,942 |
| Events in quadrant B | 6,355,584 | 2,247,894 |
| Events in quadrant C | 5,776,069 | 2,167,119 |
| Events in quadrant D | 16,342,568 | 1,919,180 |
| Mode SS | |||
|---|---|---|---|
| Quadrant | BADHDUFLAG | Total packets | Discarded packets |
| A | 0 | 544 | 0 |
| B | 0 | 544 | 0 |
| C | 0 | 544 | 0 |
| D | 0 | 544 | 0 |
| Mode M0 | |||
|---|---|---|---|
| Quadrant | BADHDUFLAG | Total packets | Discarded packets |
| A | 0 | 56597 | 0 |
| B | 0 | 57673 | 0 |
| C | 0 | 57017 | 0 |
| D | 0 | 103943 | 0 |
| Mode M9 | |||
|---|---|---|---|
| Quadrant | BADHDUFLAG | Total packets | Discarded packets |
| A | 0 | 69 | 0 |
| B | 0 | 69 | 0 |
| C | 0 | 69 | 0 |
| D | 0 | 69 | 0 |
| Quadrant | Total seconds | Saturated seconds | Saturation percentage |
|---|---|---|---|
| A | 26700 | 449 | 1.681648% |
| B | 26700 | 544 | 2.037453% |
| C | 26700 | 640 | 2.397004% |
| D | 26700 | 4460 | 16.704120% |
Noise dominated data is calculated using 1-second bins in cleaned event files. If a bin has >2000 counts, and if more than 50% of those come from <1% of pixels, then it is considered to be noise-dominated and hence unusable.
| Quadrant | # 1 sec bins | Bins with >0 counts | Bins with >2000 counts | High rate bins dominated by noise | Noise dominated (total time) | Noise dominated (detector-on time) | Marked lightcurve |
|---|---|---|---|---|---|---|---|
| A | 32610 | 26700 | 0 | 0 | 0.00% | 0.00% | 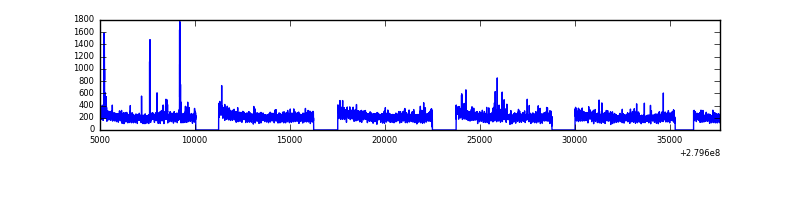 |
| B | 32610 | 26700 | 3 | 3 | 0.01% | 0.01% |  |
| C | 32610 | 26700 | 1 | 1 | 0.00% | 0.00% |  |
| D | 32610 | 26698 | 426 | 426 | 1.31% | 1.60% |  |
Top three noisy pixels from each quadrant. If the there are fewer than three noisy pixels in the level2.evt file, extra rows are filled as -1
| Pixel properties | Quadrant properties | ||||||
|---|---|---|---|---|---|---|---|
| Quadrant | DetID | PixID | Counts | Sigma | Mean | Median | Sigma |
| A | 15 | 174 | 73772 | 220.49 | 1532 | 1505 | 327.8 |
| A | 12 | 189 | 39770 | 116.75 | 1532 | 1505 | 327.8 |
| A | 0 | 23 | 36639 | 107.2 | 1532 | 1505 | 327.8 |
| B | 10 | 16 | 92131 | 320.93 | 1560 | 1528 | 282.3 |
| B | 0 | 189 | 68664 | 237.8 | 1560 | 1528 | 282.3 |
| B | 4 | 216 | 53602 | 184.45 | 1560 | 1528 | 282.3 |
| C | 5 | 112 | 14771 | 38.64 | 1494 | 1488 | 343.8 |
| C | 3 | 233 | 14086 | 36.65 | 1494 | 1488 | 343.8 |
| C | 13 | 61 | 8781 | 21.22 | 1494 | 1488 | 343.8 |
| D | 1 | 52 | 10113088 | 31849.69 | 1412 | 1369 | 317.5 |
| D | 11 | 66 | 430713 | 1352.34 | 1412 | 1369 | 317.5 |
| D | 12 | 32 | 165636 | 517.4 | 1412 | 1369 | 317.5 |
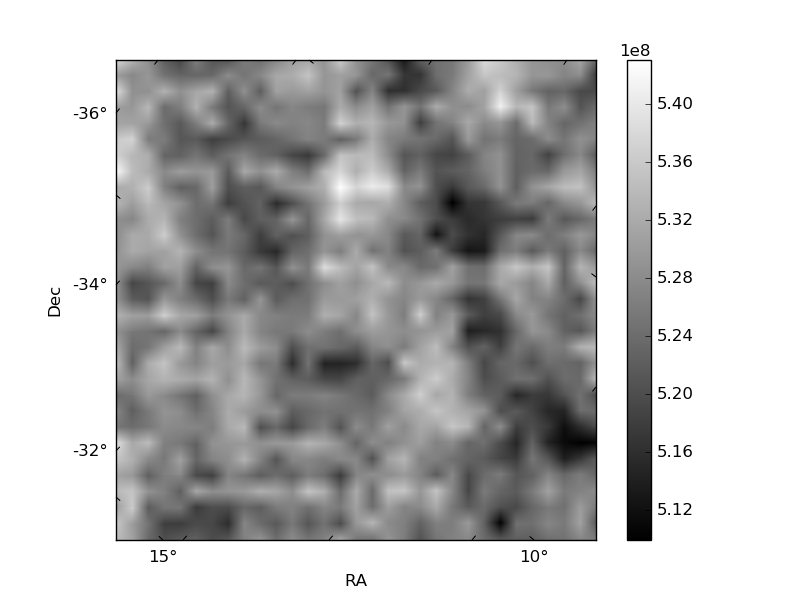
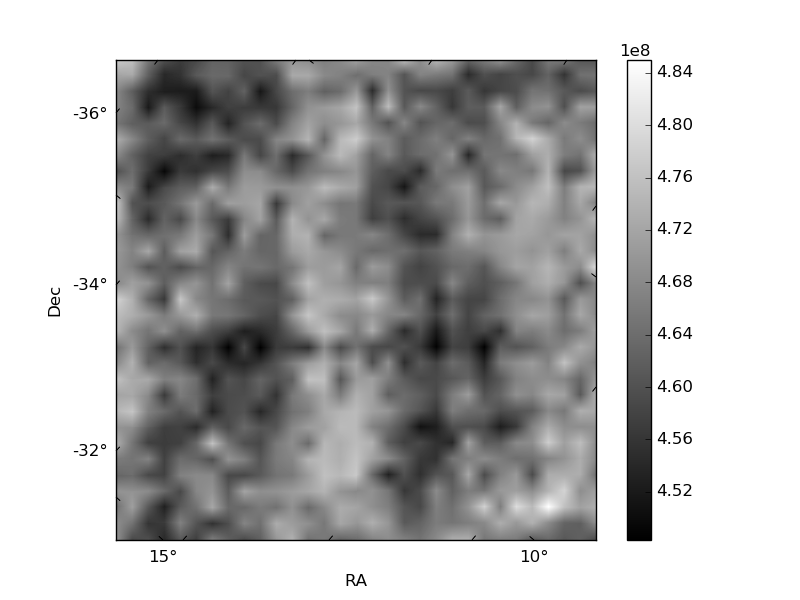
Histogram calculated using DETX and DETY for each event in the final _common_clean file
| Quadrant A |  |
 |
Quadrant B |
|---|---|---|---|
| Quadrant D |  |
 |
Quadrant C |
| Plot type | Count rate plots | Images |
|---|---|---|
| Comparison with Poisson distribution Blue bars denote a histogram of data divided into 1 sec bins. Red curve is a Poisson curve with rate = median count rate of data. |
 |
 |
| Quadrant-wise count rates Data is divided into 100 sec bins |
 |
|
| Module-wise count rates for Quadrant A Data is divided into 100 sec bins |
 |
 |
| Module-wise count rates for Quadrant B Data is divided into 100 sec bins |
 |
 |
| Module-wise count rates for Quadrant C Data is divided into 100 sec bins |
 |
 |
| Module-wise count rates for Quadrant D Data is divided into 100 sec bins |
 |
 |
| Parameter | Plot |
|---|---|
| CZT HV Monitor |  |
| D_VDD |  |
| Temperature 1 |  |
| Veto HV Monitor |  |
| Veto LLD |  |
| Alpha Counter |  |
| _CPM_Rate |  |
| CZT Counter |  |
| +2.5 Volts monitor | 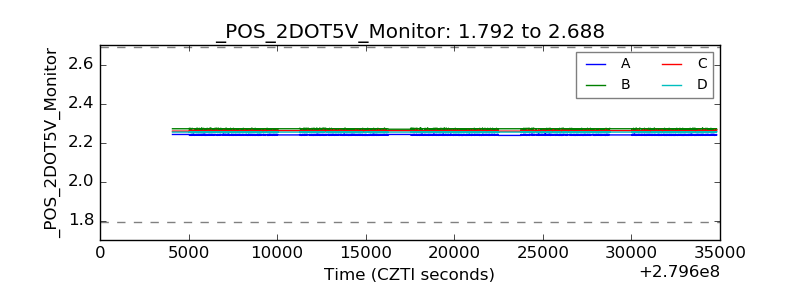 |
| +5 Volts monitor |  |
| _ROLL_ROT |  |
| _Roll_DEC |  |
| _Roll_RA |  |
| Veto Counter | 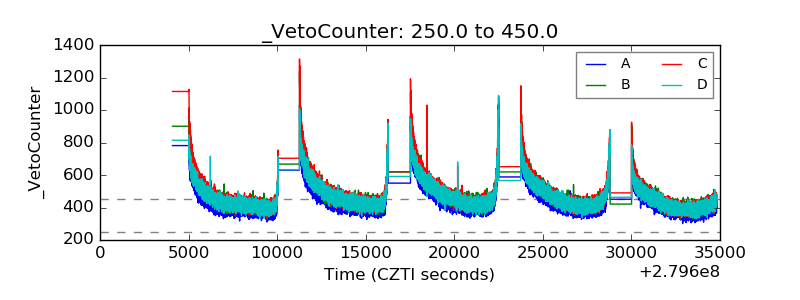 |