| Param | Original file | Final file |
|---|---|---|
| Filename | modeM0/AS1A05_004T06_9000002506cztM0_level2_bc.evt | modeM0/AS1A05_004T06_9000002506cztM0_level2_quad_clean.evt |
| Size (bytes) | 3,405,847,680 | 785,183,040 |
| Size | 3.2 GB | 748.8 MB |
| Events in quadrant A | 23,375,863 | 4,941,998 |
| Events in quadrant B | 15,938,226 | 5,235,591 |
| Events in quadrant C | 12,721,507 | 5,053,258 |
| Events in quadrant D | 46,740,198 | 4,145,752 |
| Mode M9 | |||
|---|---|---|---|
| Quadrant | BADHDUFLAG | Total packets | Discarded packets |
| A | 0 | 91 | 0 |
| B | 0 | 91 | 0 |
| C | 0 | 91 | 0 |
| D | 0 | 91 | 0 |
| Mode SS | |||
|---|---|---|---|
| Quadrant | BADHDUFLAG | Total packets | Discarded packets |
| A | 0 | 1308 | 0 |
| B | 0 | 1308 | 0 |
| C | 0 | 1308 | 0 |
| D | 0 | 1308 | 0 |
| Mode M0 | |||
|---|---|---|---|
| Quadrant | BADHDUFLAG | Total packets | Discarded packets |
| A | 0 | 184613 | 0 |
| B | 0 | 142824 | 0 |
| C | 0 | 132250 | 0 |
| D | 0 | 284431 | 0 |
| Quadrant | Total seconds | Saturated seconds | Saturation percentage |
|---|---|---|---|
| A | 64120 | 6354 | 9.909545% |
| B | 64121 | 1116 | 1.740459% |
| C | 64121 | 784 | 1.222688% |
| D | 64120 | 17286 | 26.958827% |
Noise dominated data is calculated using 1-second bins in cleaned event files. If a bin has >2000 counts, and if more than 50% of those come from <1% of pixels, then it is considered to be noise-dominated and hence unusable.
| Quadrant | # 1 sec bins | Bins with >0 counts | Bins with >2000 counts | High rate bins dominated by noise | Noise dominated (total time) | Noise dominated (detector-on time) | Marked lightcurve |
|---|---|---|---|---|---|---|---|
| A | 78425 | 64127 | 143 | 143 | 0.18% | 0.22% |  |
| B | 78425 | 64123 | 46 | 46 | 0.06% | 0.07% |  |
| C | 78425 | 64125 | 2 | 2 | 0.00% | 0.00% |  |
| D | 78425 | 64119 | 1785 | 1785 | 2.28% | 2.78% |  |
Top three noisy pixels from each quadrant. If the there are fewer than three noisy pixels in the level2.evt file, extra rows are filled as -1
| Pixel properties | Quadrant properties | ||||||
|---|---|---|---|---|---|---|---|
| Quadrant | DetID | PixID | Counts | Sigma | Mean | Median | Sigma |
| A | 15 | 174 | 10813884 | 15508.97 | 3203 | 3139 | 697.1 |
| A | 0 | 23 | 75712 | 104.11 | 3203 | 3139 | 697.1 |
| A | 15 | 190 | 71980 | 98.76 | 3203 | 3139 | 697.1 |
| B | 15 | 35 | 882202 | 1406.16 | 3357 | 3271 | 625.1 |
| B | 10 | 16 | 880377 | 1403.24 | 3357 | 3271 | 625.1 |
| B | 0 | 219 | 295629 | 467.73 | 3357 | 3271 | 625.1 |
| C | 3 | 233 | 213994 | 280.19 | 3224 | 3209 | 752.3 |
| C | 5 | 112 | 65259 | 82.48 | 3224 | 3209 | 752.3 |
| C | 7 | 247 | 24595 | 28.43 | 3224 | 3209 | 752.3 |
| D | 1 | 52 | 34275943 | 52225.91 | 2834 | 2737 | 656.2 |
| D | 10 | 70 | 551188 | 835.74 | 2834 | 2737 | 656.2 |
| D | 12 | 32 | 423319 | 640.89 | 2834 | 2737 | 656.2 |
Histogram calculated using DETX and DETY for each event in the final _common_clean file
| Quadrant A |  |
 |
Quadrant B |
|---|---|---|---|
| Quadrant D | 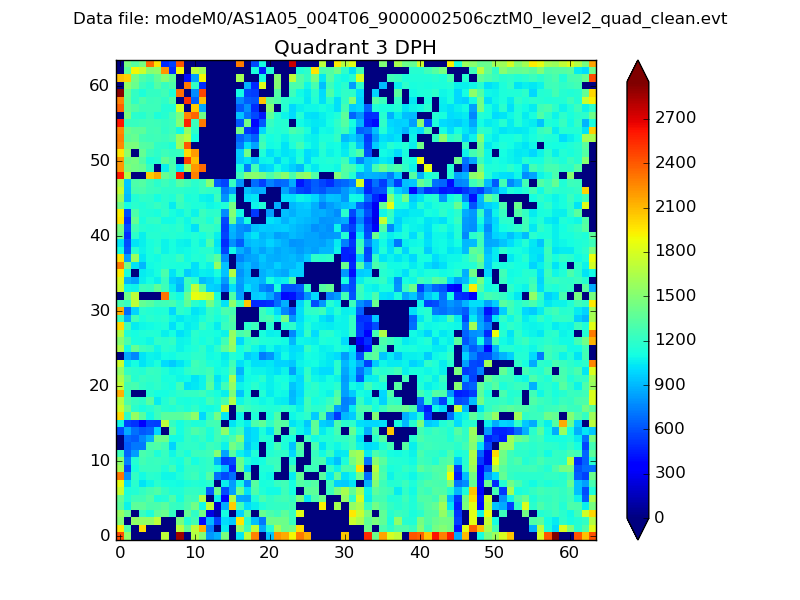 |
 |
Quadrant C |
| Plot type | Count rate plots | Images |
|---|---|---|
| Comparison with Poisson distribution Blue bars denote a histogram of data divided into 1 sec bins. Red curve is a Poisson curve with rate = median count rate of data. |
 |
 |
| Quadrant-wise count rates Data is divided into 100 sec bins |
 |
|
| Module-wise count rates for Quadrant A Data is divided into 100 sec bins |
 |
 |
| Module-wise count rates for Quadrant B Data is divided into 100 sec bins |
 |
 |
| Module-wise count rates for Quadrant C Data is divided into 100 sec bins |
 |
 |
| Module-wise count rates for Quadrant D Data is divided into 100 sec bins |
 |
 |
| Parameter | Plot |
|---|---|
| CZT HV Monitor |  |
| D_VDD |  |
| Temperature 1 |  |
| Veto HV Monitor |  |
| Veto LLD |  |
| Alpha Counter |  |
| _CPM_Rate |  |
| CZT Counter |  |
| +2.5 Volts monitor |  |
| +5 Volts monitor |  |
| _ROLL_ROT |  |
| _Roll_DEC |  |
| _Roll_RA | 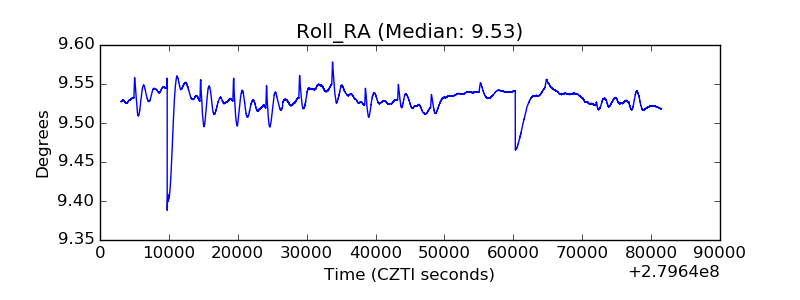 |
| Veto Counter |  |