| Param | Original file | Final file |
|---|---|---|
| Filename | modeM0/AS1T03_034T01_9000002500cztM0_level2_bc.evt | modeM0/AS1T03_034T01_9000002500cztM0_level2_quad_clean.evt |
| Size (bytes) | 1,924,479,360 | 525,441,600 |
| Size | 1.8 GB | 501.1 MB |
| Events in quadrant A | 9,869,184 | 3,318,805 |
| Events in quadrant B | 10,771,501 | 3,377,173 |
| Events in quadrant C | 9,044,800 | 3,249,355 |
| Events in quadrant D | 25,601,828 | 2,952,965 |
| Mode M0 | |||
|---|---|---|---|
| Quadrant | BADHDUFLAG | Total packets | Discarded packets |
| A | 0 | 93363 | 0 |
| B | 0 | 96394 | 0 |
| C | 0 | 91314 | 0 |
| D | 0 | 163114 | 0 |
| Mode SS | |||
|---|---|---|---|
| Quadrant | BADHDUFLAG | Total packets | Discarded packets |
| A | 0 | 898 | 0 |
| B | 0 | 898 | 0 |
| C | 0 | 898 | 0 |
| D | 0 | 898 | 0 |
| Mode M9 | |||
|---|---|---|---|
| Quadrant | BADHDUFLAG | Total packets | Discarded packets |
| A | 0 | 74 | 0 |
| B | 0 | 74 | 0 |
| C | 0 | 74 | 0 |
| D | 0 | 74 | 0 |
| Quadrant | Total seconds | Saturated seconds | Saturation percentage |
|---|---|---|---|
| A | 43902 | 652 | 1.485126% |
| B | 43903 | 757 | 1.724256% |
| C | 43903 | 753 | 1.715145% |
| D | 43902 | 7683 | 17.500342% |
Noise dominated data is calculated using 1-second bins in cleaned event files. If a bin has >2000 counts, and if more than 50% of those come from <1% of pixels, then it is considered to be noise-dominated and hence unusable.
| Quadrant | # 1 sec bins | Bins with >0 counts | Bins with >2000 counts | High rate bins dominated by noise | Noise dominated (total time) | Noise dominated (detector-on time) | Marked lightcurve |
|---|---|---|---|---|---|---|---|
| A | 54246 | 43903 | 4 | 4 | 0.01% | 0.01% |  |
| B | 54246 | 43904 | 7 | 7 | 0.01% | 0.02% |  |
| C | 54246 | 43903 | 1 | 1 | 0.00% | 0.00% | 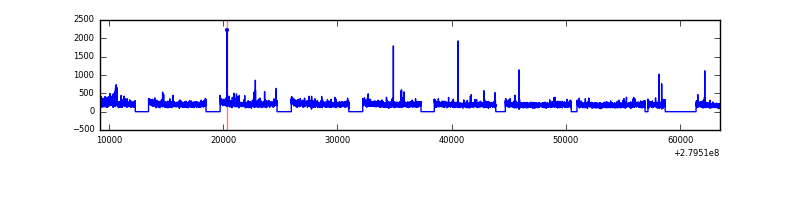 |
| D | 54246 | 43892 | 728 | 728 | 1.34% | 1.66% | 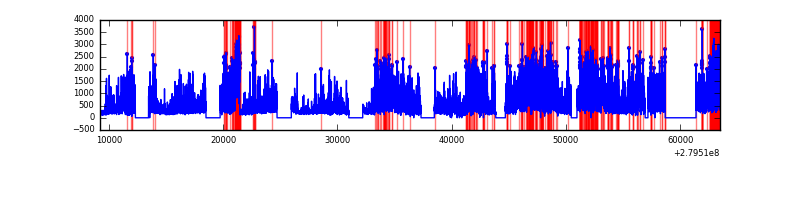 |
Top three noisy pixels from each quadrant. If the there are fewer than three noisy pixels in the level2.evt file, extra rows are filled as -1
| Pixel properties | Quadrant properties | ||||||
|---|---|---|---|---|---|---|---|
| Quadrant | DetID | PixID | Counts | Sigma | Mean | Median | Sigma |
| A | 0 | 23 | 443030 | 866.33 | 2372 | 2323 | 508.7 |
| A | 15 | 174 | 244414 | 475.9 | 2372 | 2323 | 508.7 |
| A | 9 | 143 | 52195 | 98.04 | 2372 | 2323 | 508.7 |
| B | 15 | 35 | 498280 | 1113.79 | 2389 | 2327 | 445.3 |
| B | 10 | 16 | 228491 | 507.91 | 2389 | 2327 | 445.3 |
| B | 0 | 229 | 196390 | 435.82 | 2389 | 2327 | 445.3 |
| C | 3 | 233 | 144069 | 267.02 | 2297 | 2286 | 531.0 |
| C | 0 | 207 | 55301 | 99.84 | 2297 | 2286 | 531.0 |
| C | 13 | 61 | 13642 | 21.39 | 2297 | 2286 | 531.0 |
| D | 1 | 52 | 16485880 | 32828.7 | 2179 | 2100 | 502.1 |
| D | 10 | 70 | 293015 | 579.38 | 2179 | 2100 | 502.1 |
| D | 2 | 234 | 183035 | 360.35 | 2179 | 2100 | 502.1 |
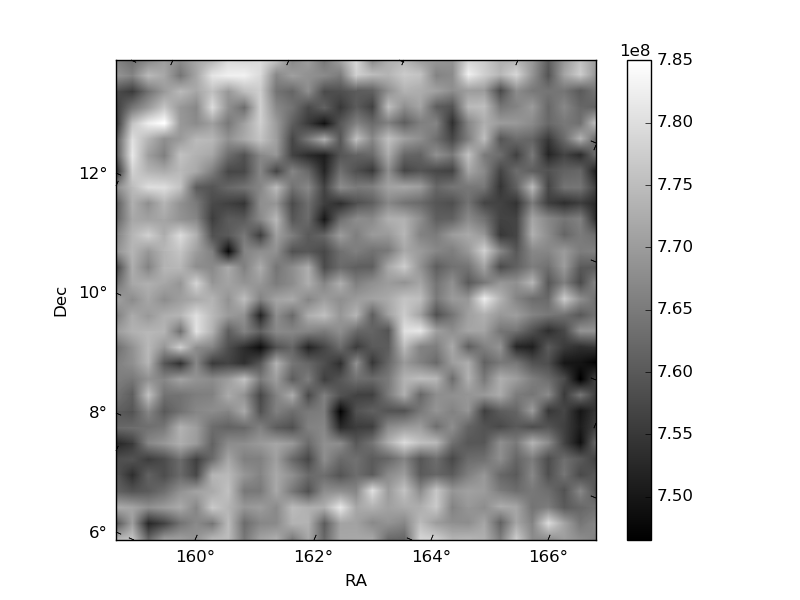
Histogram calculated using DETX and DETY for each event in the final _common_clean file
| Quadrant A | 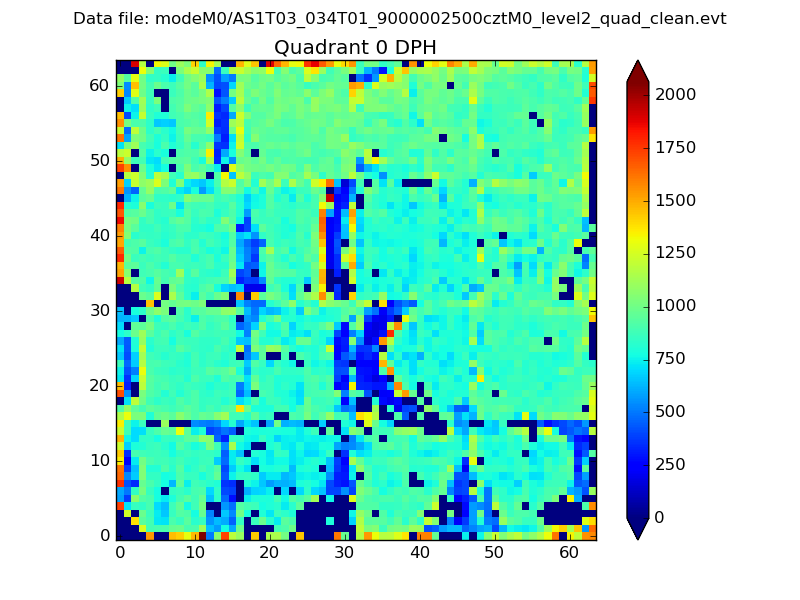 |
 |
Quadrant B |
|---|---|---|---|
| Quadrant D |  |
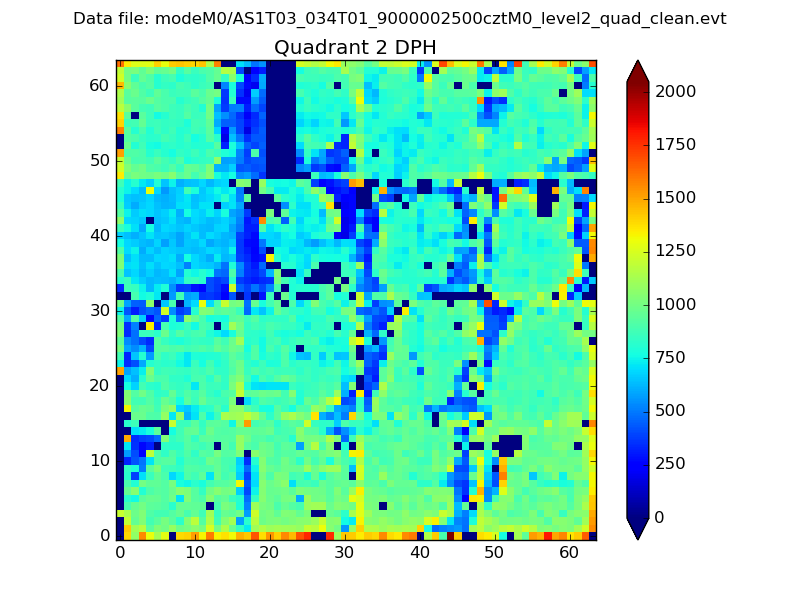 |
Quadrant C |
| Plot type | Count rate plots | Images |
|---|---|---|
| Comparison with Poisson distribution Blue bars denote a histogram of data divided into 1 sec bins. Red curve is a Poisson curve with rate = median count rate of data. |
 |
 |
| Quadrant-wise count rates Data is divided into 100 sec bins |
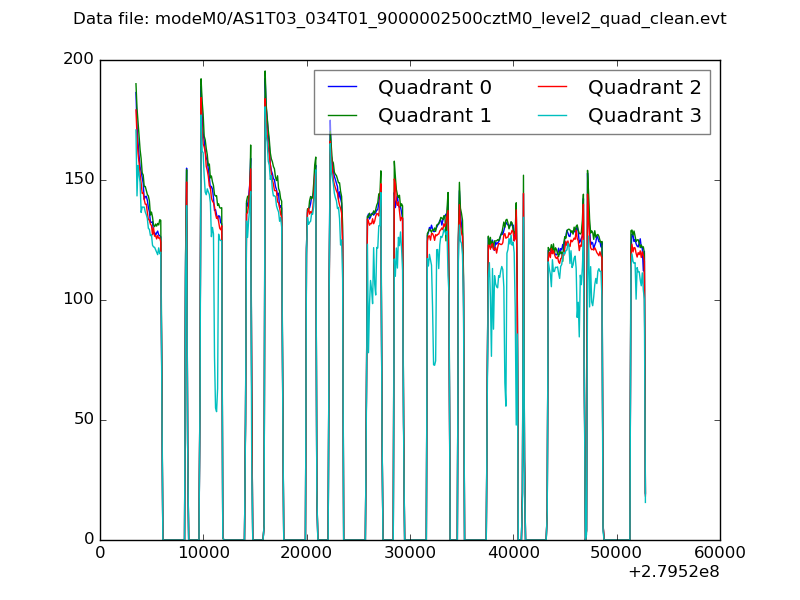 |
|
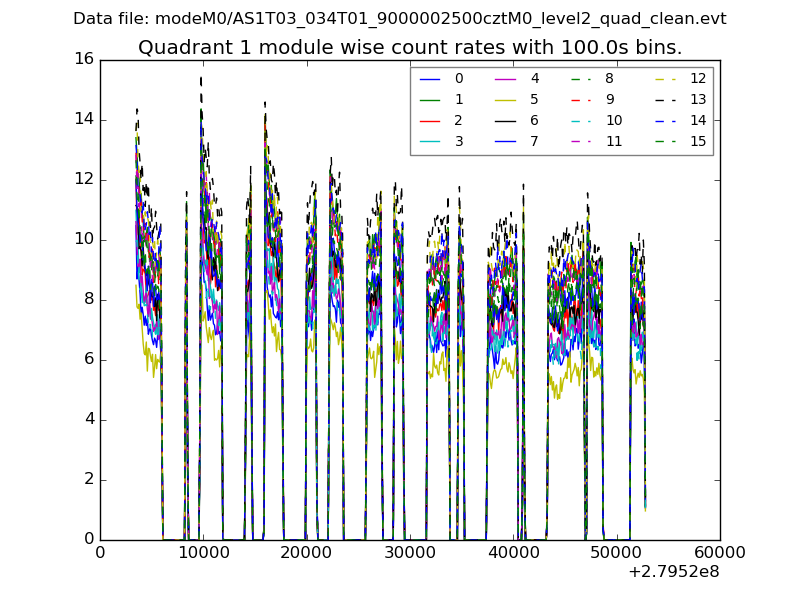
| Module-wise count rates for Quadrant A Data is divided into 100 sec bins |
 |
 |
| Module-wise count rates for Quadrant B Data is divided into 100 sec bins |
 |
 |
| Module-wise count rates for Quadrant C Data is divided into 100 sec bins |
 |
 |
| Module-wise count rates for Quadrant D Data is divided into 100 sec bins |
 |
 |
| Parameter | Plot |
|---|---|
| CZT HV Monitor |  |
| D_VDD |  |
| Temperature 1 |  |
| Veto HV Monitor |  |
| Veto LLD |  |
| Alpha Counter |  |
| _CPM_Rate |  |
| CZT Counter | 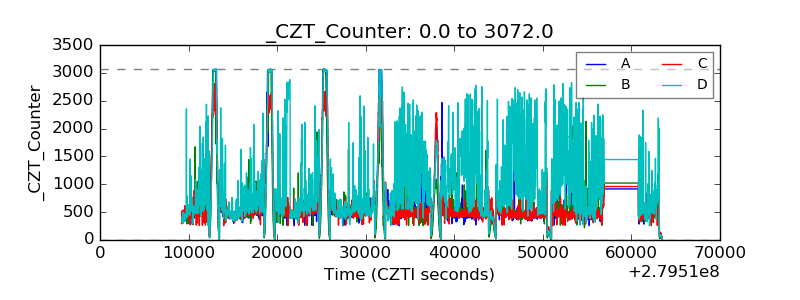 |
| +2.5 Volts monitor |  |
| +5 Volts monitor |  |
| _ROLL_ROT |  |
| _Roll_DEC | 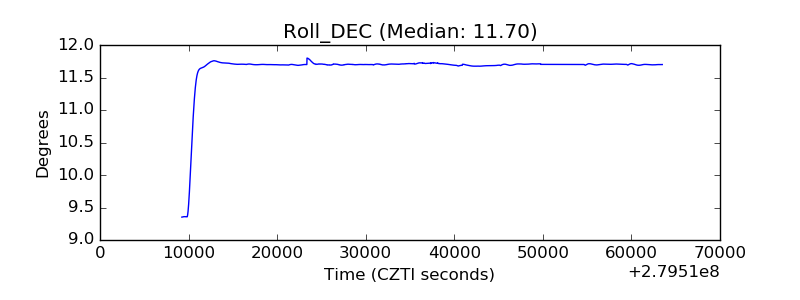 |
| _Roll_RA |  |
| Veto Counter |  |