| Param | Original file | Final file |
|---|---|---|
| Filename | modeM0/AS1A05_101T05_9000002502cztM0_level2_bc.evt | modeM0/AS1A05_101T05_9000002502cztM0_level2_quad_clean.evt |
| Size (bytes) | 1,319,405,760 | 309,424,320 |
| Size | 1.2 GB | 295.1 MB |
| Events in quadrant A | 5,031,030 | 2,112,850 |
| Events in quadrant B | 6,362,336 | 2,109,546 |
| Events in quadrant C | 4,479,649 | 2,081,326 |
| Events in quadrant D | 22,537,852 | 1,506,283 |
| Mode SS | |||
|---|---|---|---|
| Quadrant | BADHDUFLAG | Total packets | Discarded packets |
| A | 0 | 462 | 0 |
| B | 0 | 462 | 0 |
| C | 0 | 462 | 0 |
| D | 0 | 462 | 0 |
| Mode M0 | |||
|---|---|---|---|
| Quadrant | BADHDUFLAG | Total packets | Discarded packets |
| A | 0 | 47947 | 0 |
| B | 0 | 53153 | 0 |
| C | 0 | 46595 | 0 |
| D | 0 | 120314 | 0 |
| Mode M9 | |||
|---|---|---|---|
| Quadrant | BADHDUFLAG | Total packets | Discarded packets |
| A | 0 | 38 | 0 |
| B | 0 | 38 | 0 |
| C | 0 | 38 | 0 |
| D | 0 | 38 | 0 |
| Quadrant | Total seconds | Saturated seconds | Saturation percentage |
|---|---|---|---|
| A | 22637 | 242 | 1.069046% |
| B | 22637 | 839 | 3.706322% |
| C | 22637 | 231 | 1.020453% |
| D | 22637 | 8733 | 38.578434% |
Noise dominated data is calculated using 1-second bins in cleaned event files. If a bin has >2000 counts, and if more than 50% of those come from <1% of pixels, then it is considered to be noise-dominated and hence unusable.
| Quadrant | # 1 sec bins | Bins with >0 counts | Bins with >2000 counts | High rate bins dominated by noise | Noise dominated (total time) | Noise dominated (detector-on time) | Marked lightcurve |
|---|---|---|---|---|---|---|---|
| A | 26263 | 22638 | 6 | 6 | 0.02% | 0.03% |  |
| B | 26262 | 22635 | 104 | 104 | 0.40% | 0.46% | 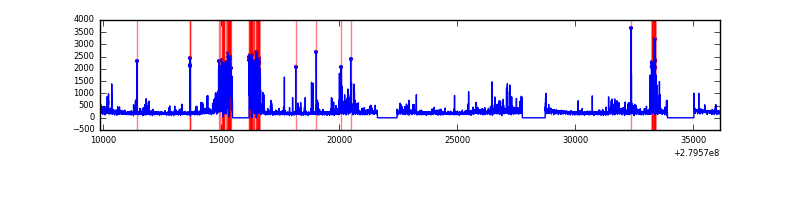 |
| C | 26262 | 22637 | 0 | 0 | 0.00% | 0.00% |  |
| D | 26262 | 22629 | 1392 | 1392 | 5.30% | 6.15% |  |
Top three noisy pixels from each quadrant. If the there are fewer than three noisy pixels in the level2.evt file, extra rows are filled as -1
| Pixel properties | Quadrant properties | ||||||
|---|---|---|---|---|---|---|---|
| Quadrant | DetID | PixID | Counts | Sigma | Mean | Median | Sigma |
| A | 15 | 174 | 532317 | 2127.47 | 1137 | 1113 | 249.7 |
| A | 9 | 143 | 45274 | 176.87 | 1137 | 1113 | 249.7 |
| A | 13 | 228 | 25968 | 99.54 | 1137 | 1113 | 249.7 |
| B | 10 | 16 | 1337702 | 6092.89 | 1138 | 1107 | 219.4 |
| B | 15 | 35 | 203996 | 924.87 | 1138 | 1107 | 219.4 |
| B | 0 | 189 | 113546 | 512.55 | 1138 | 1107 | 219.4 |
| C | 3 | 233 | 125227 | 474.42 | 1106 | 1098 | 261.6 |
| C | 15 | 127 | 67542 | 253.95 | 1106 | 1098 | 261.6 |
| C | 0 | 207 | 12169 | 42.31 | 1106 | 1098 | 261.6 |
| D | 1 | 52 | 18775361 | 87733.17 | 910 | 878 | 214.0 |
| D | 10 | 70 | 122569 | 568.66 | 910 | 878 | 214.0 |
| D | 2 | 234 | 77588 | 358.47 | 910 | 878 | 214.0 |
Histogram calculated using DETX and DETY for each event in the final _common_clean file
| Quadrant A |  |
 |
Quadrant B |
|---|---|---|---|
| Quadrant D | 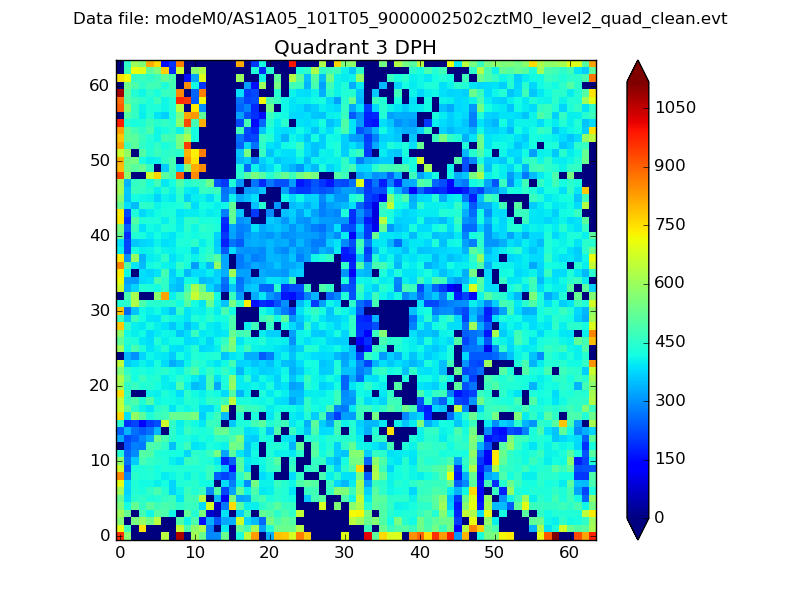 |
 |
Quadrant C |
| Plot type | Count rate plots | Images |
|---|---|---|
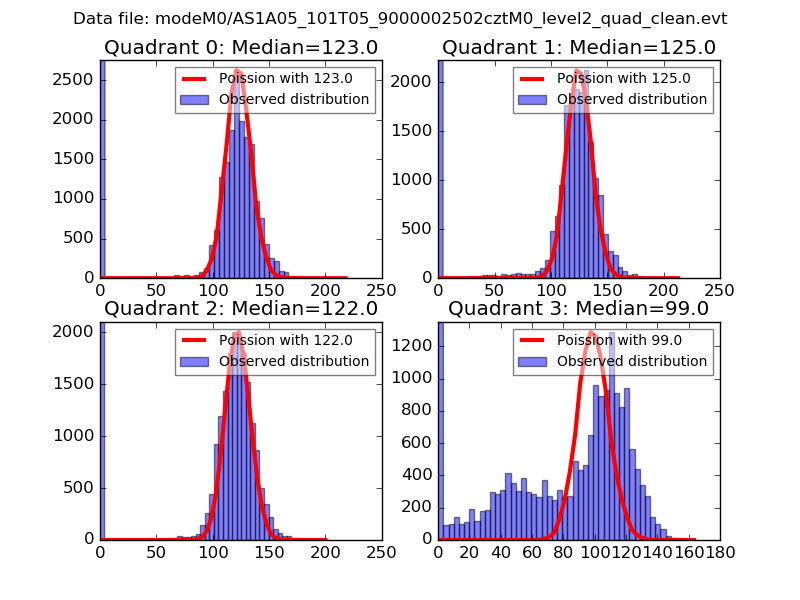
| Comparison with Poisson distribution Blue bars denote a histogram of data divided into 1 sec bins. Red curve is a Poisson curve with rate = median count rate of data. |
 |
 |
| Quadrant-wise count rates Data is divided into 100 sec bins |
 |
|
| Module-wise count rates for Quadrant A Data is divided into 100 sec bins |
 |
 |
| Module-wise count rates for Quadrant B Data is divided into 100 sec bins |
 |
 |
| Module-wise count rates for Quadrant C Data is divided into 100 sec bins |
 |
 |
| Module-wise count rates for Quadrant D Data is divided into 100 sec bins |
 |
 |
| Parameter | Plot |
|---|---|
| CZT HV Monitor |  |
| D_VDD |  |
| Temperature 1 |  |
| Veto HV Monitor |  |
| Veto LLD |  |
| Alpha Counter |  |
| _CPM_Rate |  |
| CZT Counter |  |
| +2.5 Volts monitor |  |
| +5 Volts monitor |  |
| _ROLL_ROT |  |
| _Roll_DEC |  |
| _Roll_RA |  |
| Veto Counter |  |