| Param | Original file | Final file |
|---|---|---|
| Filename | modeM0/AS1A05_056T01_9000002498cztM0_level2_bc.evt | modeM0/AS1A05_056T01_9000002498cztM0_level2_quad_clean.evt |
| Size (bytes) | 6,785,651,520 | 2,179,831,680 |
| Size | 6.3 GB | 2.0 GB |
| Events in quadrant A | 46,249,736 | 13,745,253 |
| Events in quadrant B | 40,538,335 | 14,065,800 |
| Events in quadrant C | 40,742,077 | 13,257,721 |
| Events in quadrant D | 65,975,029 | 12,877,133 |
| Mode M9 | |||
|---|---|---|---|
| Quadrant | BADHDUFLAG | Total packets | Discarded packets |
| A | 0 | 275 | 0 |
| B | 0 | 275 | 0 |
| C | 0 | 275 | 0 |
| D | 0 | 275 | 0 |
| Mode M0 | |||
|---|---|---|---|
| Quadrant | BADHDUFLAG | Total packets | Discarded packets |
| A | 0 | 396753 | 0 |
| B | 0 | 376490 | 0 |
| C | 0 | 386065 | 0 |
| D | 0 | 472920 | 0 |
| Mode SS | |||
|---|---|---|---|
| Quadrant | BADHDUFLAG | Total packets | Discarded packets |
| A | 0 | 3594 | 0 |
| B | 0 | 3594 | 0 |
| C | 0 | 3594 | 0 |
| D | 0 | 3594 | 0 |
| Quadrant | Total seconds | Saturated seconds | Saturation percentage |
|---|---|---|---|
| A | 176326 | 3928 | 2.227692% |
| B | 176326 | 2203 | 1.249390% |
| C | 176326 | 2865 | 1.624831% |
| D | 176326 | 8027 | 4.552363% |
Noise dominated data is calculated using 1-second bins in cleaned event files. If a bin has >2000 counts, and if more than 50% of those come from <1% of pixels, then it is considered to be noise-dominated and hence unusable.
| Quadrant | # 1 sec bins | Bins with >0 counts | Bins with >2000 counts | High rate bins dominated by noise | Noise dominated (total time) | Noise dominated (detector-on time) | Marked lightcurve |
|---|---|---|---|---|---|---|---|
| A | 203892 | 176332 | 585 | 585 | 0.29% | 0.33% | 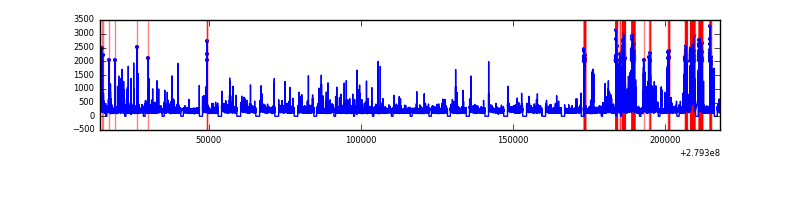 |
| B | 203892 | 176329 | 27 | 27 | 0.01% | 0.02% |  |
| C | 203892 | 176329 | 5 | 5 | 0.00% | 0.00% |  |
| D | 203892 | 176322 | 1247 | 1247 | 0.61% | 0.71% |  |
Top three noisy pixels from each quadrant. If the there are fewer than three noisy pixels in the level2.evt file, extra rows are filled as -1
| Pixel properties | Quadrant properties | ||||||
|---|---|---|---|---|---|---|---|
| Quadrant | DetID | PixID | Counts | Sigma | Mean | Median | Sigma |
| A | 0 | 23 | 9087628 | 4566.09 | 9247 | 9086 | 1988.3 |
| A | 9 | 143 | 611484 | 302.98 | 9247 | 9086 | 1988.3 |
| A | 0 | 226 | 553059 | 273.59 | 9247 | 9086 | 1988.3 |
| B | 0 | 229 | 1845347 | 1052.53 | 9426 | 9184 | 1744.5 |
| B | 10 | 16 | 1015993 | 577.12 | 9426 | 9184 | 1744.5 |
| B | 15 | 35 | 468714 | 263.41 | 9426 | 9184 | 1744.5 |
| C | 3 | 233 | 5169133 | 2457.68 | 8999 | 8948 | 2099.6 |
| C | 0 | 207 | 822830 | 387.63 | 8999 | 8948 | 2099.6 |
| C | 7 | 247 | 189819 | 86.14 | 8999 | 8948 | 2099.6 |
| D | 1 | 52 | 24773240 | 11968.12 | 9011 | 8694 | 2069.2 |
| D | 5 | 222 | 5151338 | 2485.32 | 9011 | 8694 | 2069.2 |
| D | 2 | 234 | 638553 | 304.4 | 9011 | 8694 | 2069.2 |
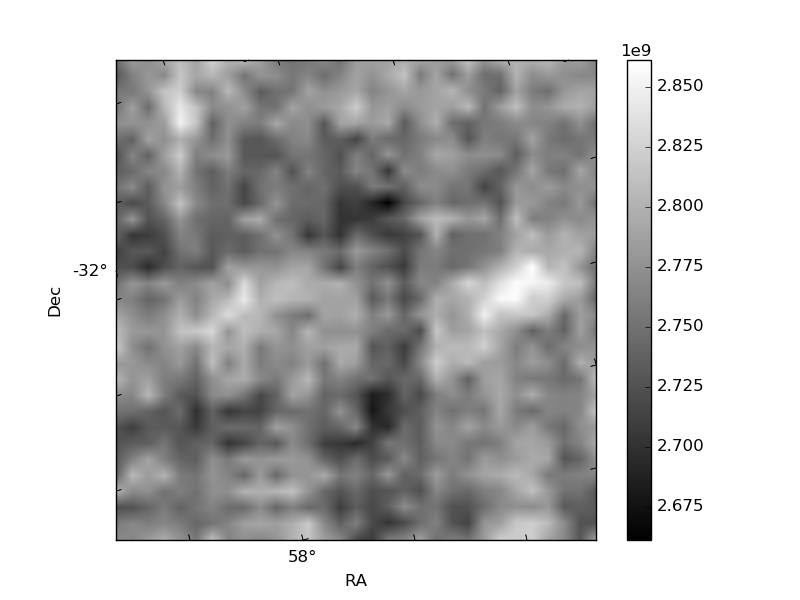
Histogram calculated using DETX and DETY for each event in the final _common_clean file
| Quadrant A |  |
 |
Quadrant B |
|---|---|---|---|
| Quadrant D | 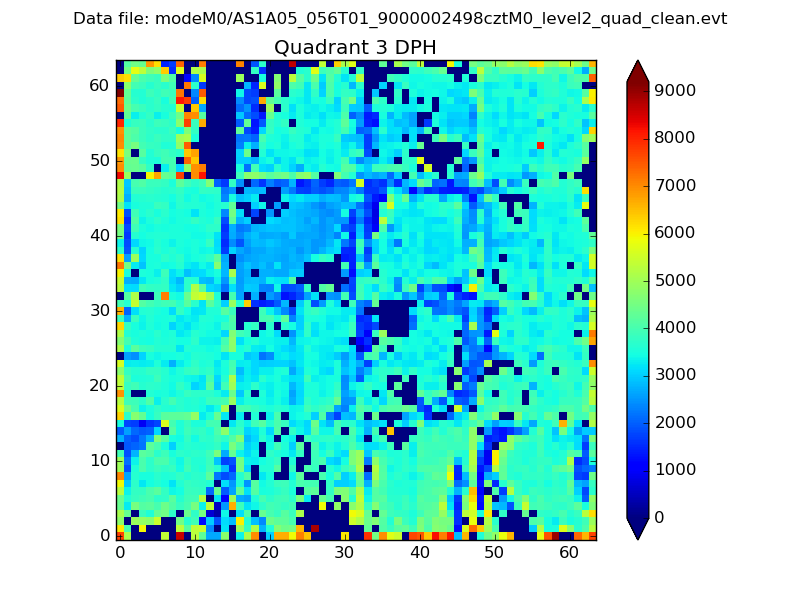 |
 |
Quadrant C |
| Plot type | Count rate plots | Images |
|---|---|---|
| Comparison with Poisson distribution Blue bars denote a histogram of data divided into 1 sec bins. Red curve is a Poisson curve with rate = median count rate of data. |
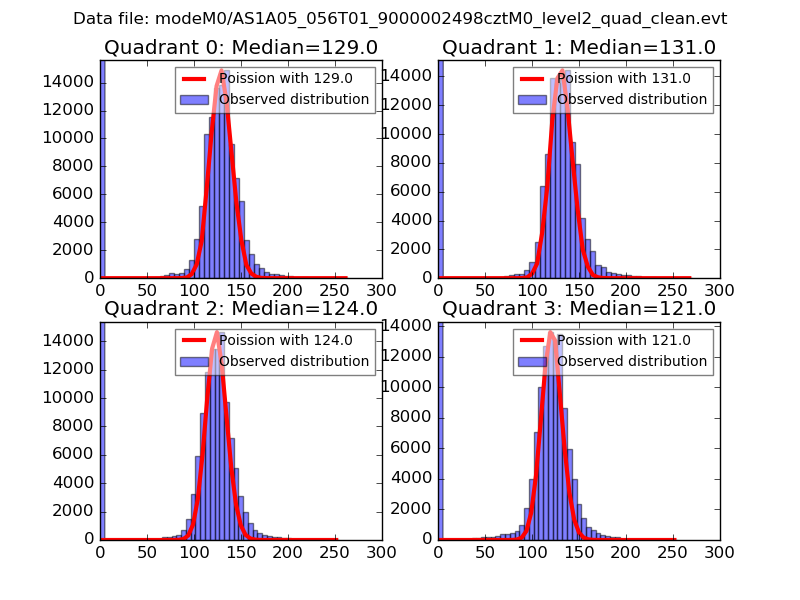 |
 |
| Quadrant-wise count rates Data is divided into 100 sec bins |
 |
|
| Module-wise count rates for Quadrant A Data is divided into 100 sec bins |
 |
 |
| Module-wise count rates for Quadrant B Data is divided into 100 sec bins |
 |
 |
| Module-wise count rates for Quadrant C Data is divided into 100 sec bins |
 |
 |
| Module-wise count rates for Quadrant D Data is divided into 100 sec bins |
 |
 |
| Parameter | Plot |
|---|---|
| CZT HV Monitor |  |
| D_VDD |  |
| Temperature 1 |  |
| Veto HV Monitor | 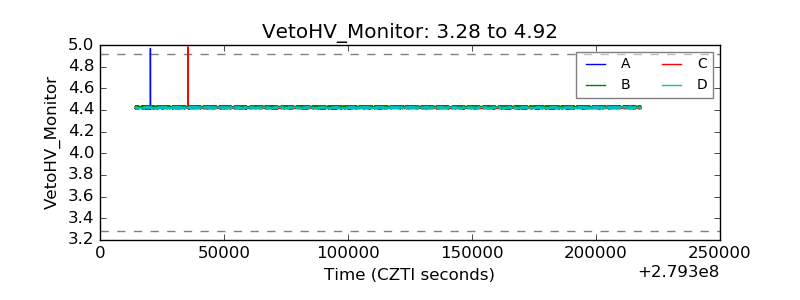 |
| Veto LLD |  |
| Alpha Counter |  |
| _CPM_Rate |  |
| CZT Counter |  |
| +2.5 Volts monitor |  |
| +5 Volts monitor | 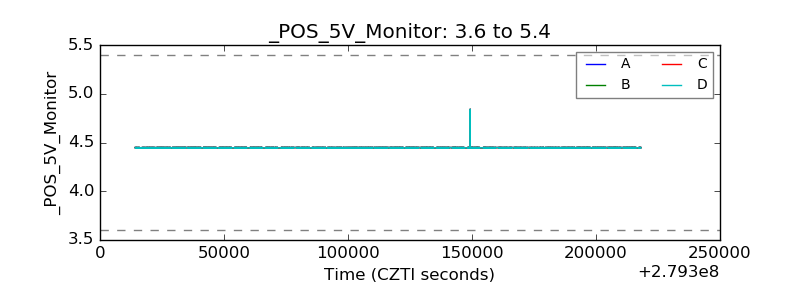 |
| _ROLL_ROT |  |
| _Roll_DEC |  |
| _Roll_RA |  |
| Veto Counter | 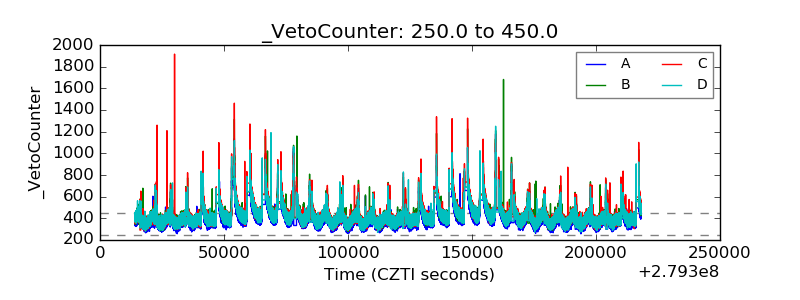 |