| Param | Original file | Final file |
|---|---|---|
| Filename | modeM0/AS1A05_004T07_9000002492cztM0_level2_bc.evt | modeM0/AS1A05_004T07_9000002492cztM0_level2_quad_clean.evt |
| Size (bytes) | 2,809,558,080 | 783,786,240 |
| Size | 2.6 GB | 747.5 MB |
| Events in quadrant A | 19,482,442 | 5,050,816 |
| Events in quadrant B | 13,924,447 | 5,183,158 |
| Events in quadrant C | 16,952,735 | 4,945,577 |
| Events in quadrant D | 30,786,419 | 4,585,004 |
| Mode M9 | |||
|---|---|---|---|
| Quadrant | BADHDUFLAG | Total packets | Discarded packets |
| A | 0 | 107 | 0 |
| B | 0 | 107 | 0 |
| C | 0 | 107 | 0 |
| D | 0 | 107 | 0 |
| Mode SS | |||
|---|---|---|---|
| Quadrant | BADHDUFLAG | Total packets | Discarded packets |
| A | 0 | 1182 | 0 |
| B | 0 | 1182 | 0 |
| C | 0 | 1182 | 0 |
| D | 0 | 1182 | 0 |
| Mode M0 | |||
|---|---|---|---|
| Quadrant | BADHDUFLAG | Total packets | Discarded packets |
| A | 0 | 148483 | 0 |
| B | 0 | 127050 | 0 |
| C | 0 | 140884 | 0 |
| D | 0 | 193142 | 0 |
| Quadrant | Total seconds | Saturated seconds | Saturation percentage |
|---|---|---|---|
| A | 57920 | 2894 | 4.996547% |
| B | 57920 | 917 | 1.583218% |
| C | 57920 | 1282 | 2.213398% |
| D | 57920 | 6096 | 10.524862% |
Noise dominated data is calculated using 1-second bins in cleaned event files. If a bin has >2000 counts, and if more than 50% of those come from <1% of pixels, then it is considered to be noise-dominated and hence unusable.
| Quadrant | # 1 sec bins | Bins with >0 counts | Bins with >2000 counts | High rate bins dominated by noise | Noise dominated (total time) | Noise dominated (detector-on time) | Marked lightcurve |
|---|---|---|---|---|---|---|---|
| A | 68596 | 57918 | 424 | 424 | 0.62% | 0.73% |  |
| B | 68596 | 57921 | 17 | 17 | 0.02% | 0.03% |  |
| C | 68596 | 57922 | 8 | 8 | 0.01% | 0.01% |  |
| D | 68596 | 57913 | 893 | 893 | 1.30% | 1.54% |  |
Top three noisy pixels from each quadrant. If the there are fewer than three noisy pixels in the level2.evt file, extra rows are filled as -1
| Pixel properties | Quadrant properties | ||||||
|---|---|---|---|---|---|---|---|
| Quadrant | DetID | PixID | Counts | Sigma | Mean | Median | Sigma |
| A | 15 | 174 | 4438439 | 6603.99 | 3096 | 3034 | 671.6 |
| A | 10 | 234 | 2958033 | 4399.77 | 3096 | 3034 | 671.6 |
| A | 15 | 190 | 101632 | 146.8 | 3096 | 3034 | 671.6 |
| B | 15 | 35 | 575333 | 980.91 | 3139 | 3065 | 583.4 |
| B | 0 | 229 | 551205 | 939.55 | 3139 | 3065 | 583.4 |
| B | 0 | 189 | 212581 | 359.13 | 3139 | 3065 | 583.4 |
| C | 3 | 233 | 4469665 | 6410.09 | 2986 | 2969 | 696.8 |
| C | 0 | 207 | 709235 | 1013.55 | 2986 | 2969 | 696.8 |
| C | 7 | 247 | 297920 | 423.28 | 2986 | 2969 | 696.8 |
| D | 1 | 52 | 15703783 | 23088.09 | 2957 | 2863 | 680.0 |
| D | 12 | 110 | 1374962 | 2017.66 | 2957 | 2863 | 680.0 |
| D | 12 | 218 | 959070 | 1406.1 | 2957 | 2863 | 680.0 |
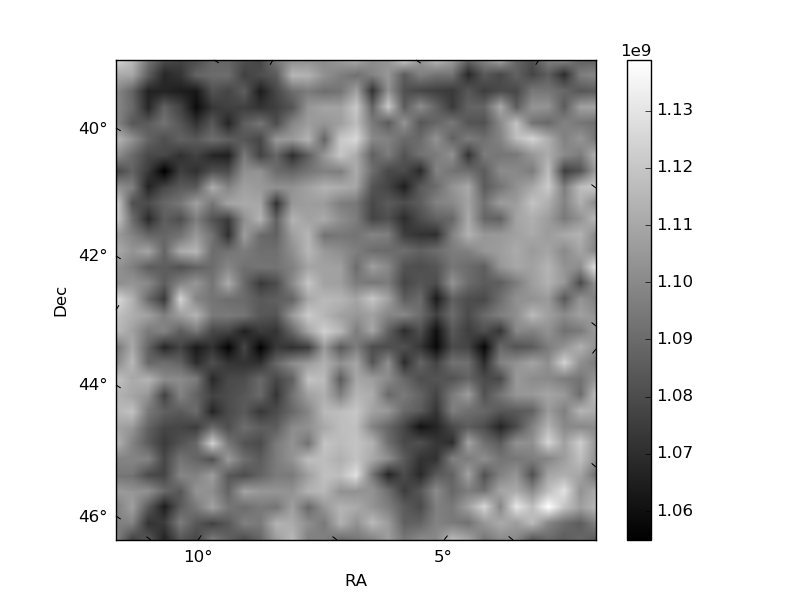
Histogram calculated using DETX and DETY for each event in the final _common_clean file
| Quadrant A |  |
 |
Quadrant B |
|---|---|---|---|
| Quadrant D |  |
 |
Quadrant C |
| Plot type | Count rate plots | Images |
|---|---|---|
| Comparison with Poisson distribution Blue bars denote a histogram of data divided into 1 sec bins. Red curve is a Poisson curve with rate = median count rate of data. |
 |
 |
| Quadrant-wise count rates Data is divided into 100 sec bins |
 |
|
| Module-wise count rates for Quadrant A Data is divided into 100 sec bins |
 |
 |
| Module-wise count rates for Quadrant B Data is divided into 100 sec bins |
 |
 |
| Module-wise count rates for Quadrant C Data is divided into 100 sec bins |
 |
 |
| Module-wise count rates for Quadrant D Data is divided into 100 sec bins |
 |
 |
| Parameter | Plot |
|---|---|
| CZT HV Monitor |  |
| D_VDD |  |
| Temperature 1 |  |
| Veto HV Monitor |  |
| Veto LLD |  |
| Alpha Counter |  |
| _CPM_Rate |  |
| CZT Counter |  |
| +2.5 Volts monitor |  |
| +5 Volts monitor |  |
| _ROLL_ROT |  |
| _Roll_DEC |  |
| _Roll_RA | 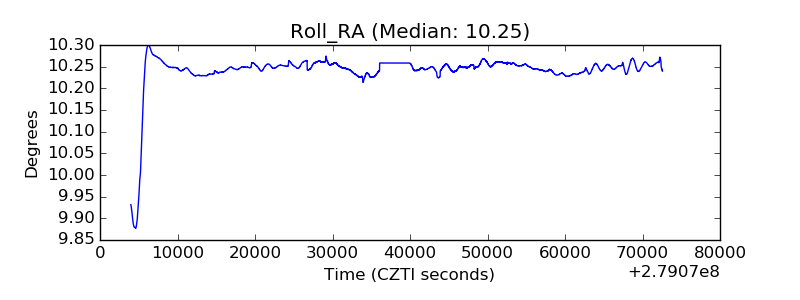 |
| Veto Counter |  |