| Param | Original file | Final file |
|---|---|---|
| Filename | modeM0/AS1A05_004T04_9000002494cztM0_level2_bc.evt | modeM0/AS1A05_004T04_9000002494cztM0_level2_quad_clean.evt |
| Size (bytes) | 3,007,010,880 | 871,721,280 |
| Size | 2.8 GB | 831.3 MB |
| Events in quadrant A | 25,489,283 | 5,511,193 |
| Events in quadrant B | 15,783,521 | 5,715,392 |
| Events in quadrant C | 17,482,296 | 5,479,309 |
| Events in quadrant D | 27,863,865 | 5,214,434 |
| Mode M9 | |||
|---|---|---|---|
| Quadrant | BADHDUFLAG | Total packets | Discarded packets |
| A | 0 | 108 | 0 |
| B | 0 | 108 | 0 |
| C | 0 | 108 | 0 |
| D | 0 | 108 | 0 |
| Mode M0 | |||
|---|---|---|---|
| Quadrant | BADHDUFLAG | Total packets | Discarded packets |
| A | 0 | 183352 | 0 |
| B | 0 | 144770 | 0 |
| C | 0 | 151750 | 0 |
| D | 0 | 193519 | 0 |
| Mode SS | |||
|---|---|---|---|
| Quadrant | BADHDUFLAG | Total packets | Discarded packets |
| A | 0 | 1326 | 0 |
| B | 0 | 1326 | 0 |
| C | 0 | 1326 | 0 |
| D | 0 | 1326 | 0 |
| Quadrant | Total seconds | Saturated seconds | Saturation percentage |
|---|---|---|---|
| A | 65355 | 5380 | 8.231964% |
| B | 65355 | 1156 | 1.768801% |
| C | 65355 | 1274 | 1.949354% |
| D | 65355 | 4902 | 7.500574% |
Noise dominated data is calculated using 1-second bins in cleaned event files. If a bin has >2000 counts, and if more than 50% of those come from <1% of pixels, then it is considered to be noise-dominated and hence unusable.
| Quadrant | # 1 sec bins | Bins with >0 counts | Bins with >2000 counts | High rate bins dominated by noise | Noise dominated (total time) | Noise dominated (detector-on time) | Marked lightcurve |
|---|---|---|---|---|---|---|---|
| A | 76081 | 65346 | 1052 | 1052 | 1.38% | 1.61% |  |
| B | 76081 | 65355 | 34 | 34 | 0.04% | 0.05% |  |
| C | 76081 | 65359 | 7 | 7 | 0.01% | 0.01% | 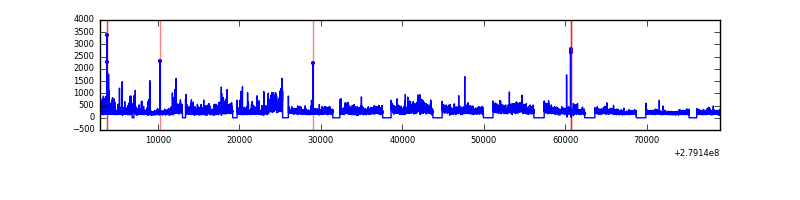 |
| D | 76081 | 65345 | 659 | 659 | 0.87% | 1.01% | 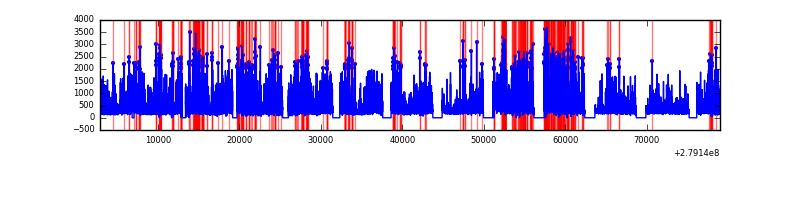 |
Top three noisy pixels from each quadrant. If the there are fewer than three noisy pixels in the level2.evt file, extra rows are filled as -1
| Pixel properties | Quadrant properties | ||||||
|---|---|---|---|---|---|---|---|
| Quadrant | DetID | PixID | Counts | Sigma | Mean | Median | Sigma |
| A | 15 | 174 | 11364524 | 15708.46 | 3366 | 3310 | 723.3 |
| A | 10 | 234 | 760276 | 1046.61 | 3366 | 3310 | 723.3 |
| A | 9 | 143 | 373242 | 511.48 | 3366 | 3310 | 723.3 |
| B | 0 | 229 | 891222 | 1367.21 | 3485 | 3396 | 649.4 |
| B | 15 | 35 | 871601 | 1336.99 | 3485 | 3396 | 649.4 |
| B | 0 | 189 | 203234 | 307.74 | 3485 | 3396 | 649.4 |
| C | 3 | 233 | 4023332 | 5171.23 | 3330 | 3315 | 777.4 |
| C | 0 | 207 | 458757 | 585.87 | 3330 | 3315 | 777.4 |
| C | 7 | 247 | 187614 | 237.08 | 3330 | 3315 | 777.4 |
| D | 1 | 52 | 11733793 | 15321.62 | 3308 | 3193 | 765.6 |
| D | 12 | 218 | 1534682 | 2000.32 | 3308 | 3193 | 765.6 |
| D | 2 | 33 | 836926 | 1088.96 | 3308 | 3193 | 765.6 |
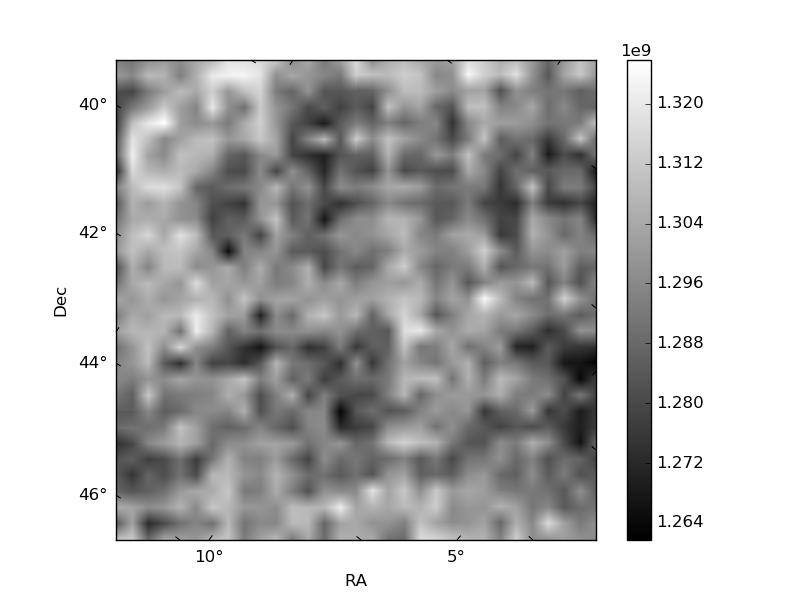
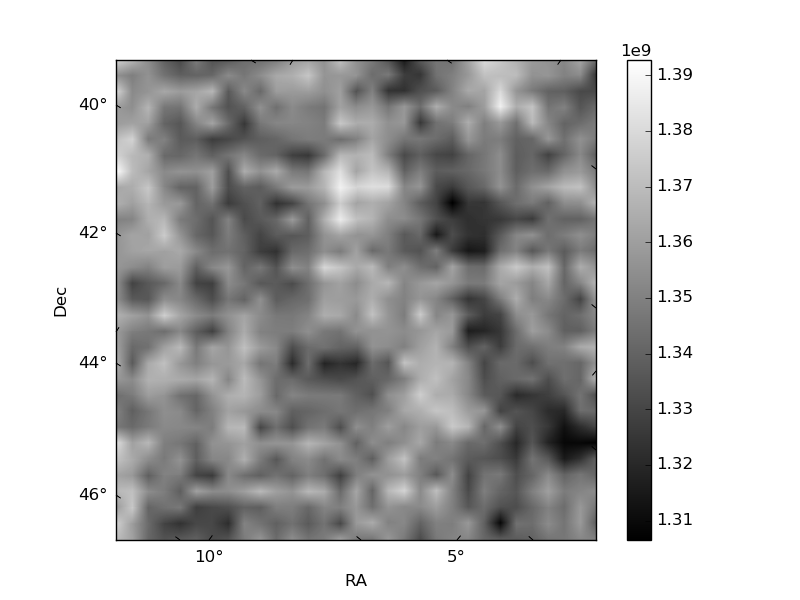
Histogram calculated using DETX and DETY for each event in the final _common_clean file
| Quadrant A | 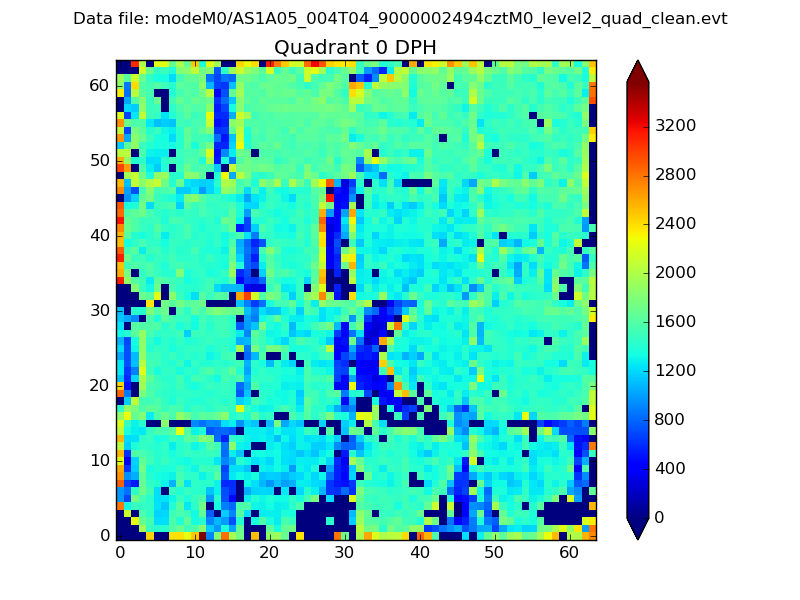 |
 |
Quadrant B |
|---|---|---|---|
| Quadrant D | 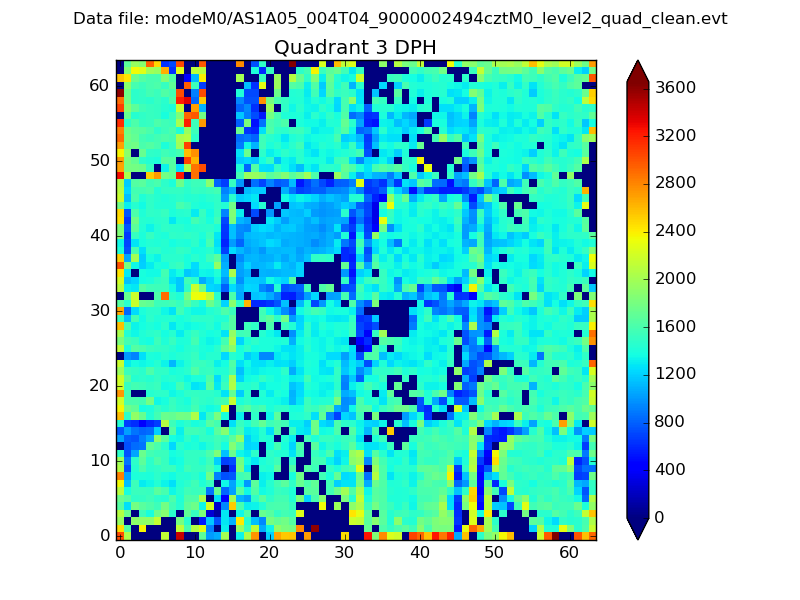 |
 |
Quadrant C |
| Plot type | Count rate plots | Images |
|---|---|---|
| Comparison with Poisson distribution Blue bars denote a histogram of data divided into 1 sec bins. Red curve is a Poisson curve with rate = median count rate of data. |
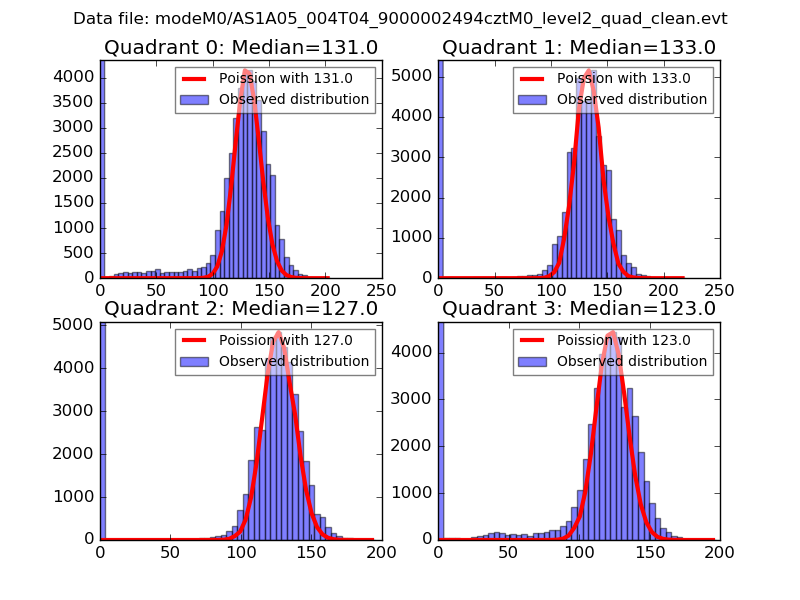 |
 |
| Quadrant-wise count rates Data is divided into 100 sec bins |
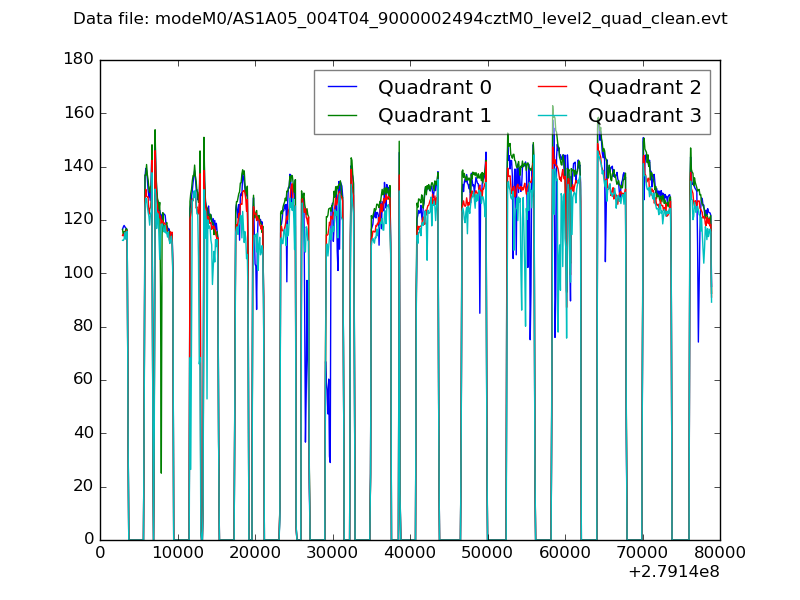 |
|
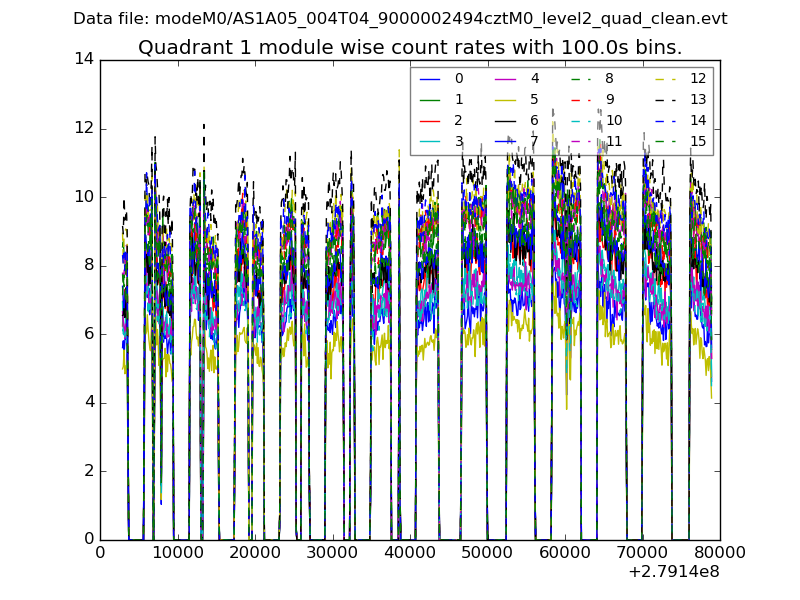
| Module-wise count rates for Quadrant A Data is divided into 100 sec bins |
 |
 |
| Module-wise count rates for Quadrant B Data is divided into 100 sec bins |
 |
 |
| Module-wise count rates for Quadrant C Data is divided into 100 sec bins |
 |
 |
| Module-wise count rates for Quadrant D Data is divided into 100 sec bins |
 |
 |
| Parameter | Plot |
|---|---|
| CZT HV Monitor | 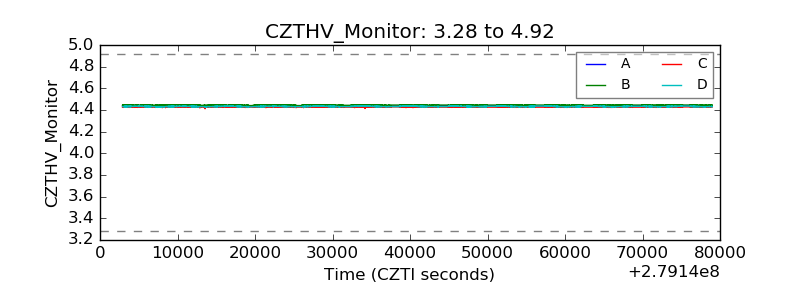 |
| D_VDD |  |
| Temperature 1 |  |
| Veto HV Monitor |  |
| Veto LLD |  |
| Alpha Counter |  |
| _CPM_Rate |  |
| CZT Counter | 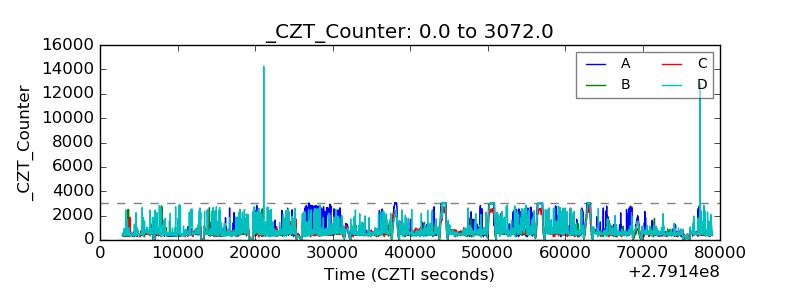 |
| +2.5 Volts monitor |  |
| +5 Volts monitor |  |
| _ROLL_ROT |  |
| _Roll_DEC |  |
| _Roll_RA |  |
| Veto Counter |  |