| Param | Original file | Final file |
|---|---|---|
| Filename | modeM0/AS1A05_004T02_9000002490cztM0_level2_bc.evt | modeM0/AS1A05_004T02_9000002490cztM0_level2_quad_clean.evt |
| Size (bytes) | 2,895,707,520 | 688,708,800 |
| Size | 2.7 GB | 656.8 MB |
| Events in quadrant A | 17,562,340 | 4,684,281 |
| Events in quadrant B | 12,525,330 | 4,838,021 |
| Events in quadrant C | 16,421,527 | 4,615,930 |
| Events in quadrant D | 37,691,420 | 3,196,929 |
| Mode M9 | |||
|---|---|---|---|
| Quadrant | BADHDUFLAG | Total packets | Discarded packets |
| A | 0 | 85 | 0 |
| B | 0 | 85 | 0 |
| C | 0 | 85 | 0 |
| D | 0 | 85 | 0 |
| Mode SS | |||
|---|---|---|---|
| Quadrant | BADHDUFLAG | Total packets | Discarded packets |
| A | 0 | 1050 | 0 |
| B | 0 | 1050 | 0 |
| C | 0 | 1050 | 0 |
| D | 0 | 1050 | 0 |
| Mode M0 | |||
|---|---|---|---|
| Quadrant | BADHDUFLAG | Total packets | Discarded packets |
| A | 0 | 135145 | 0 |
| B | 0 | 113458 | 0 |
| C | 0 | 130680 | 0 |
| D | 0 | 243464 | 0 |
| Quadrant | Total seconds | Saturated seconds | Saturation percentage |
|---|---|---|---|
| A | 51252 | 3243 | 6.327558% |
| B | 51252 | 874 | 1.705299% |
| C | 51252 | 1581 | 3.084758% |
| D | 51252 | 19189 | 37.440490% |
Noise dominated data is calculated using 1-second bins in cleaned event files. If a bin has >2000 counts, and if more than 50% of those come from <1% of pixels, then it is considered to be noise-dominated and hence unusable.
| Quadrant | # 1 sec bins | Bins with >0 counts | Bins with >2000 counts | High rate bins dominated by noise | Noise dominated (total time) | Noise dominated (detector-on time) | Marked lightcurve |
|---|---|---|---|---|---|---|---|
| A | 60043 | 51247 | 281 | 281 | 0.47% | 0.55% |  |
| B | 60043 | 51252 | 19 | 19 | 0.03% | 0.04% |  |
| C | 60043 | 51254 | 12 | 12 | 0.02% | 0.02% |  |
| D | 60043 | 51154 | 2553 | 2553 | 4.25% | 4.99% |  |
Top three noisy pixels from each quadrant. If the there are fewer than three noisy pixels in the level2.evt file, extra rows are filled as -1
| Pixel properties | Quadrant properties | ||||||
|---|---|---|---|---|---|---|---|
| Quadrant | DetID | PixID | Counts | Sigma | Mean | Median | Sigma |
| A | 15 | 174 | 6902695 | 11604.58 | 2756 | 2708 | 594.6 |
| A | 0 | 13 | 56173 | 89.92 | 2756 | 2708 | 594.6 |
| A | 8 | 144 | 18860 | 27.16 | 2756 | 2708 | 594.6 |
| B | 15 | 35 | 527948 | 1001.46 | 2817 | 2750 | 524.4 |
| B | 0 | 229 | 369601 | 699.52 | 2817 | 2750 | 524.4 |
| B | 3 | 209 | 170154 | 319.21 | 2817 | 2750 | 524.4 |
| C | 3 | 233 | 5438281 | 8711.93 | 2678 | 2666 | 623.9 |
| C | 0 | 207 | 674788 | 1077.24 | 2678 | 2666 | 623.9 |
| C | 7 | 247 | 17017 | 23.0 | 2678 | 2666 | 623.9 |
| D | 1 | 52 | 26123810 | 54107.69 | 2083 | 2011 | 482.8 |
| D | 12 | 110 | 2067730 | 4278.85 | 2083 | 2011 | 482.8 |
| D | 11 | 176 | 617628 | 1275.17 | 2083 | 2011 | 482.8 |
Histogram calculated using DETX and DETY for each event in the final _common_clean file
| Quadrant A | 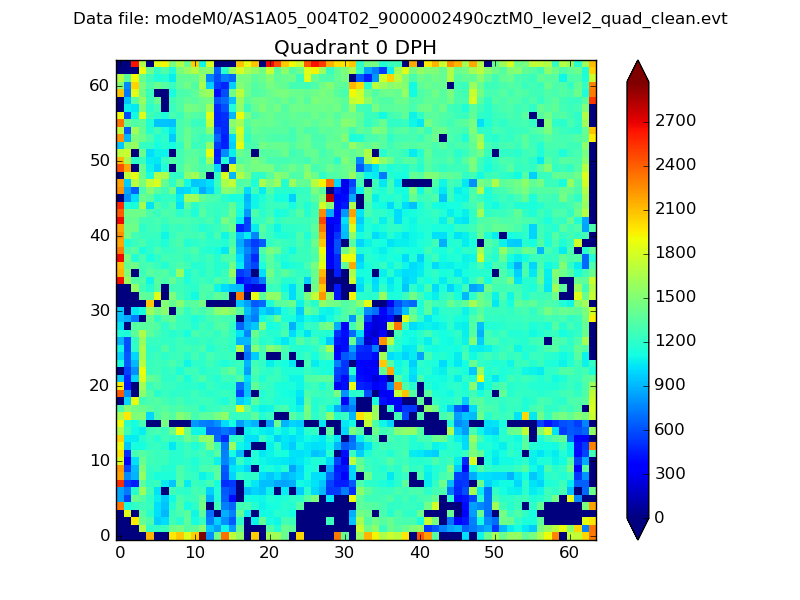 |
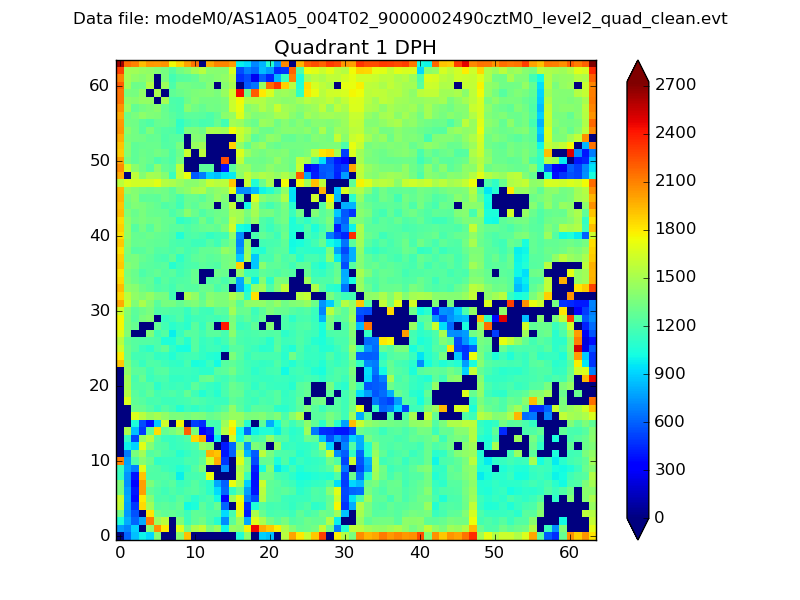 |
Quadrant B |
|---|---|---|---|
| Quadrant D |  |
 |
Quadrant C |
| Plot type | Count rate plots | Images |
|---|---|---|
| Comparison with Poisson distribution Blue bars denote a histogram of data divided into 1 sec bins. Red curve is a Poisson curve with rate = median count rate of data. |
 |
 |
| Quadrant-wise count rates Data is divided into 100 sec bins |
 |
|
| Module-wise count rates for Quadrant A Data is divided into 100 sec bins |
 |
 |
| Module-wise count rates for Quadrant B Data is divided into 100 sec bins |
 |
 |
| Module-wise count rates for Quadrant C Data is divided into 100 sec bins |
 |
 |
| Module-wise count rates for Quadrant D Data is divided into 100 sec bins |
 |
 |
| Parameter | Plot |
|---|---|
| CZT HV Monitor |  |
| D_VDD | 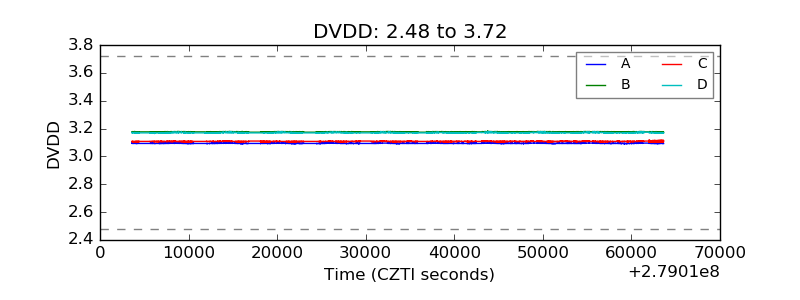 |
| Temperature 1 | 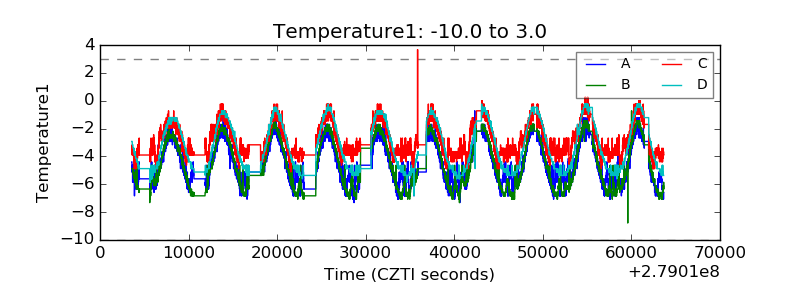 |
| Veto HV Monitor |  |
| Veto LLD |  |
| Alpha Counter | 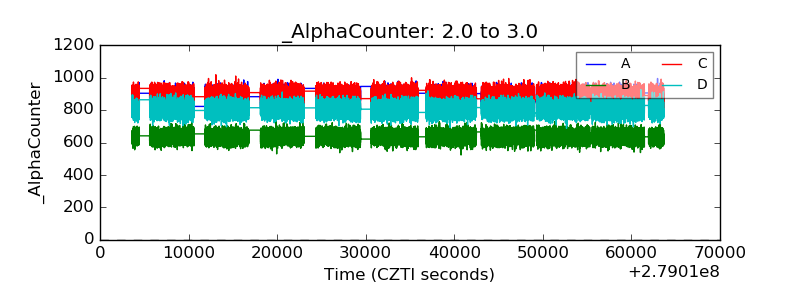 |
| _CPM_Rate | 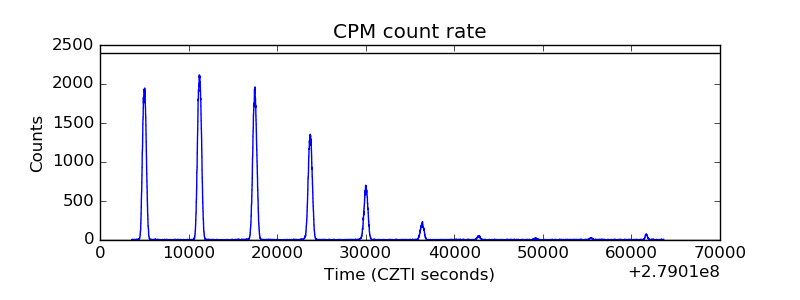 |
| CZT Counter |  |
| +2.5 Volts monitor |  |
| +5 Volts monitor |  |
| _ROLL_ROT | 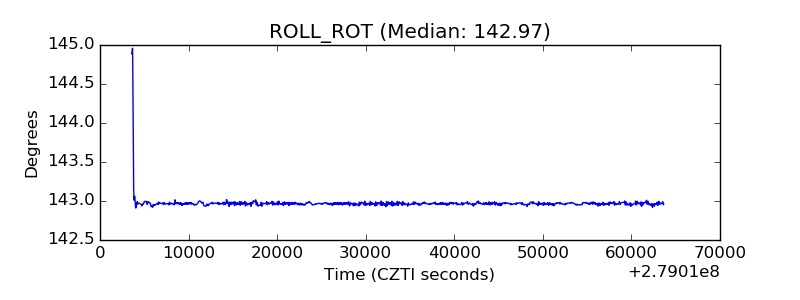 |
| _Roll_DEC |  |
| _Roll_RA |  |
| Veto Counter |  |