| Param | Original file | Final file |
|---|---|---|
| Filename | modeM0/AS1A05_004T05_9000002488cztM0_level2_bc.evt | modeM0/AS1A05_004T05_9000002488cztM0_level2_quad_clean.evt |
| Size (bytes) | 2,871,921,600 | 737,916,480 |
| Size | 2.7 GB | 703.7 MB |
| Events in quadrant A | 14,645,615 | 4,831,557 |
| Events in quadrant B | 13,675,098 | 4,891,125 |
| Events in quadrant C | 21,517,670 | 4,674,118 |
| Events in quadrant D | 33,382,202 | 4,164,573 |
| Mode M0 | |||
|---|---|---|---|
| Quadrant | BADHDUFLAG | Total packets | Discarded packets |
| A | 0 | 128314 | 0 |
| B | 0 | 122760 | 0 |
| C | 0 | 157990 | 0 |
| D | 0 | 200390 | 0 |
| Mode SS | |||
|---|---|---|---|
| Quadrant | BADHDUFLAG | Total packets | Discarded packets |
| A | 0 | 1124 | 0 |
| B | 0 | 1124 | 0 |
| C | 0 | 1124 | 0 |
| D | 0 | 1124 | 0 |
| Mode M9 | |||
|---|---|---|---|
| Quadrant | BADHDUFLAG | Total packets | Discarded packets |
| A | 0 | 93 | 0 |
| B | 0 | 93 | 0 |
| C | 0 | 93 | 0 |
| D | 0 | 94 | 0 |
| Quadrant | Total seconds | Saturated seconds | Saturation percentage |
|---|---|---|---|
| A | 55186 | 2094 | 3.794441% |
| B | 55186 | 893 | 1.618164% |
| C | 55185 | 2004 | 3.631422% |
| D | 55182 | 9129 | 16.543438% |
Noise dominated data is calculated using 1-second bins in cleaned event files. If a bin has >2000 counts, and if more than 50% of those come from <1% of pixels, then it is considered to be noise-dominated and hence unusable.
| Quadrant | # 1 sec bins | Bins with >0 counts | Bins with >2000 counts | High rate bins dominated by noise | Noise dominated (total time) | Noise dominated (detector-on time) | Marked lightcurve |
|---|---|---|---|---|---|---|---|
| A | 75104 | 55189 | 164 | 164 | 0.22% | 0.30% | 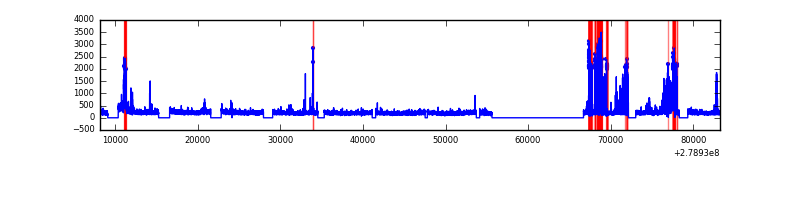 |
| B | 75104 | 55191 | 26 | 26 | 0.03% | 0.05% | 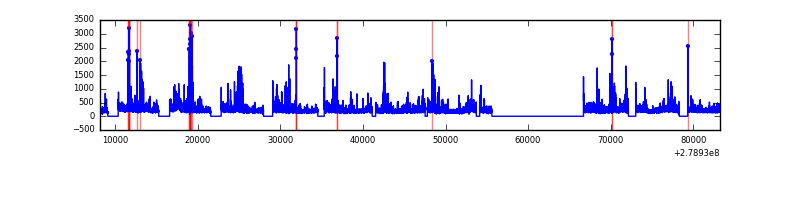 |
| C | 75104 | 55187 | 9 | 9 | 0.01% | 0.02% |  |
| D | 75104 | 55185 | 1437 | 1437 | 1.91% | 2.60% |  |
Top three noisy pixels from each quadrant. If the there are fewer than three noisy pixels in the level2.evt file, extra rows are filled as -1
| Pixel properties | Quadrant properties | ||||||
|---|---|---|---|---|---|---|---|
| Quadrant | DetID | PixID | Counts | Sigma | Mean | Median | Sigma |
| A | 15 | 174 | 3304340 | 5249.47 | 2922 | 2868 | 628.9 |
| A | 14 | 4 | 77817 | 119.17 | 2922 | 2868 | 628.9 |
| A | 3 | 1 | 43117 | 64.0 | 2922 | 2868 | 628.9 |
| B | 15 | 35 | 725574 | 1308.37 | 2950 | 2879 | 552.4 |
| B | 5 | 236 | 267241 | 478.6 | 2950 | 2879 | 552.4 |
| B | 3 | 209 | 239809 | 428.94 | 2950 | 2879 | 552.4 |
| C | 3 | 233 | 9616892 | 14608.97 | 2810 | 2798 | 658.1 |
| C | 0 | 207 | 1058637 | 1604.39 | 2810 | 2798 | 658.1 |
| C | 7 | 247 | 46693 | 66.7 | 2810 | 2798 | 658.1 |
| D | 1 | 52 | 13727282 | 22112.01 | 2693 | 2599 | 620.7 |
| D | 12 | 110 | 4108931 | 6615.76 | 2693 | 2599 | 620.7 |
| D | 13 | 232 | 1947588 | 3133.6 | 2693 | 2599 | 620.7 |
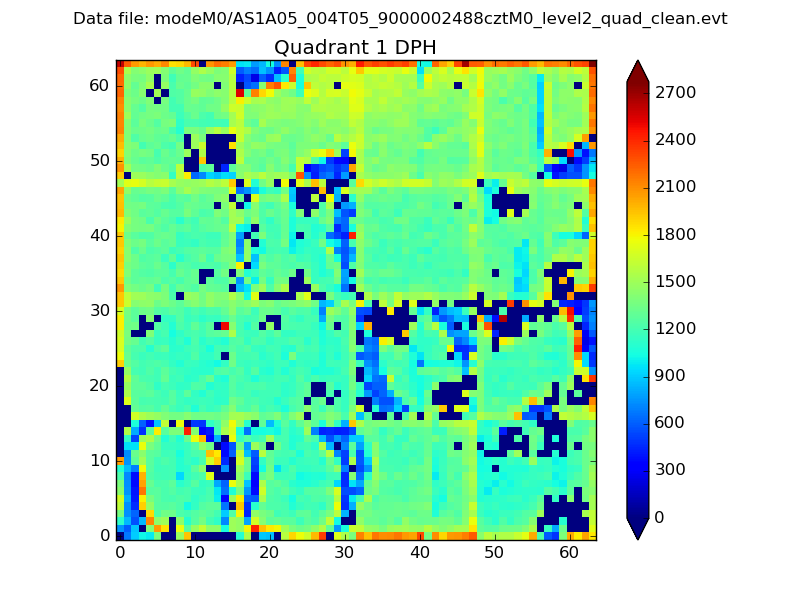
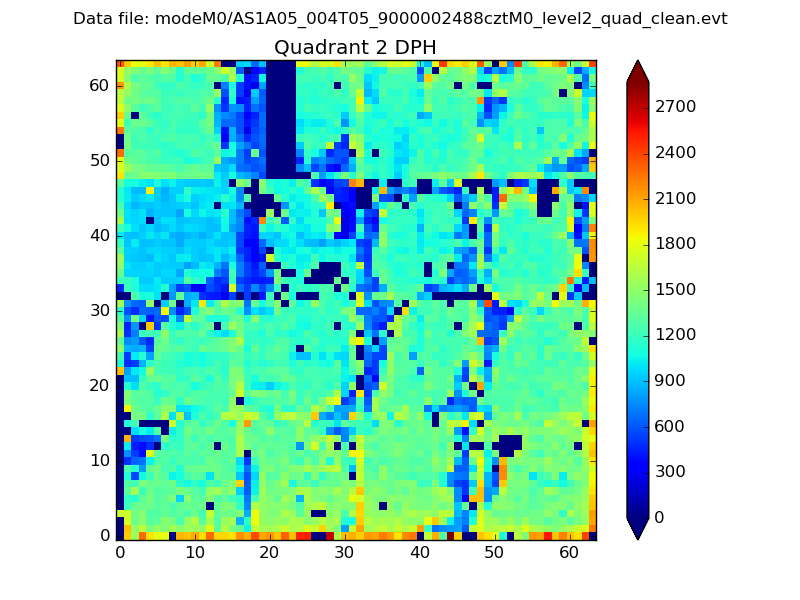
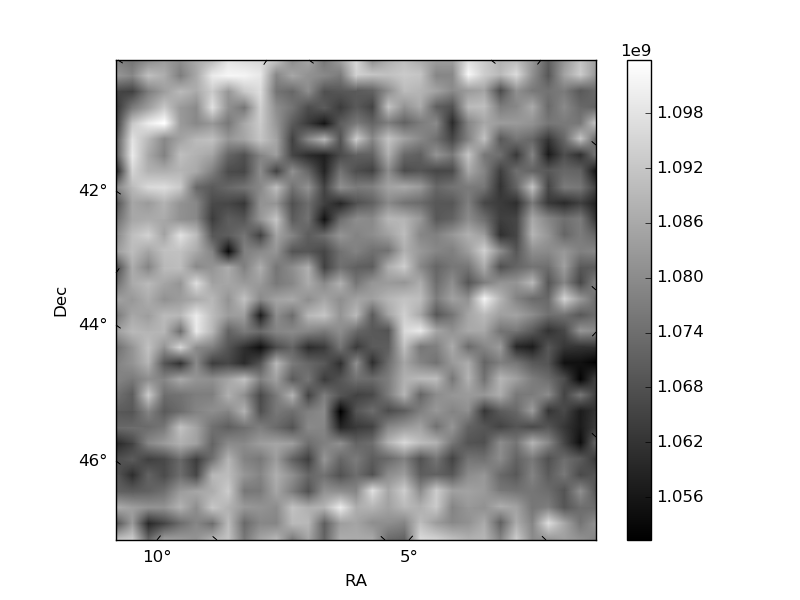
Histogram calculated using DETX and DETY for each event in the final _common_clean file
| Quadrant A |  |
 |
Quadrant B |
|---|---|---|---|
| Quadrant D |  |
 |
Quadrant C |
| Plot type | Count rate plots | Images |
|---|---|---|
| Comparison with Poisson distribution Blue bars denote a histogram of data divided into 1 sec bins. Red curve is a Poisson curve with rate = median count rate of data. |
 |
 |
| Quadrant-wise count rates Data is divided into 100 sec bins |
 |
|
| Module-wise count rates for Quadrant A Data is divided into 100 sec bins |
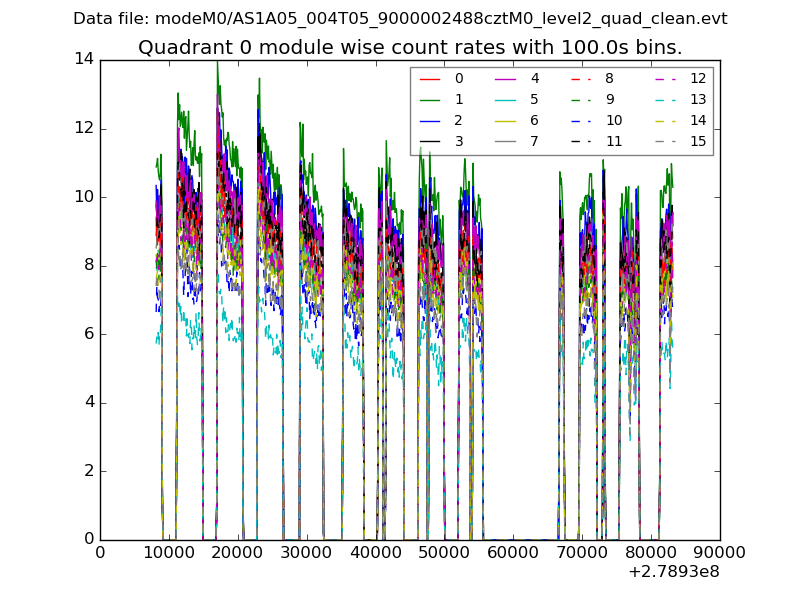 |
 |
| Module-wise count rates for Quadrant B Data is divided into 100 sec bins |
 |
 |
| Module-wise count rates for Quadrant C Data is divided into 100 sec bins |
 |
 |
| Module-wise count rates for Quadrant D Data is divided into 100 sec bins |
 |
 |
| Parameter | Plot |
|---|---|
| CZT HV Monitor |  |
| D_VDD | 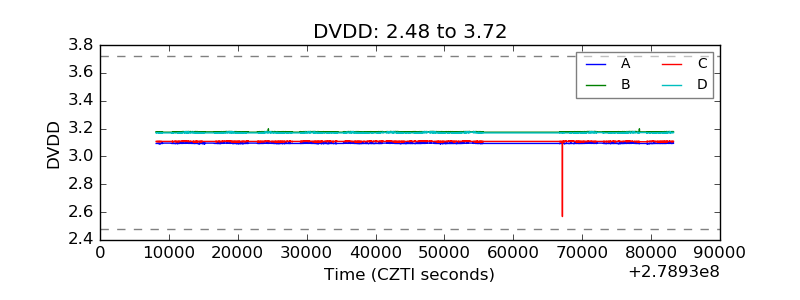 |
| Temperature 1 |  |
| Veto HV Monitor |  |
| Veto LLD |  |
| Alpha Counter |  |
| _CPM_Rate |  |
| CZT Counter |  |
| +2.5 Volts monitor |  |
| +5 Volts monitor | 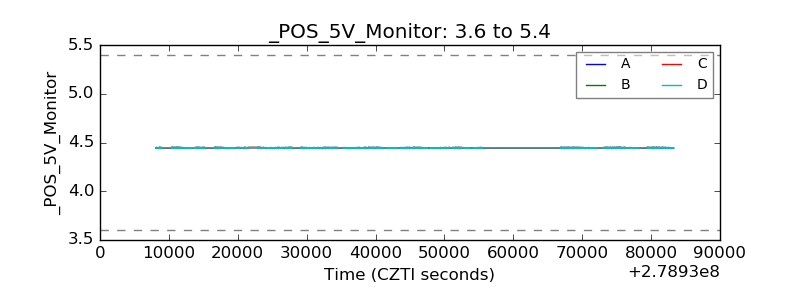 |
| _ROLL_ROT |  |
| _Roll_DEC |  |
| _Roll_RA |  |
| Veto Counter |  |