| Param | Original file | Final file |
|---|---|---|
| Filename | modeM0/AS1A05_202T01_9000002484cztM0_level2_bc.evt | modeM0/AS1A05_202T01_9000002484cztM0_level2_quad_clean.evt |
| Size (bytes) | 5,788,523,520 | 2,054,485,440 |
| Size | 5.4 GB | 1.9 GB |
| Events in quadrant A | 40,873,169 | 13,606,833 |
| Events in quadrant B | 29,192,982 | 14,231,361 |
| Events in quadrant C | 26,863,200 | 13,593,940 |
| Events in quadrant D | 70,295,691 | 12,651,150 |
| Mode M9 | |||
|---|---|---|---|
| Quadrant | BADHDUFLAG | Total packets | Discarded packets |
| A | 0 | 193 | 0 |
| B | 0 | 193 | 0 |
| C | 0 | 193 | 0 |
| D | 0 | 193 | 0 |
| Mode M0 | |||
|---|---|---|---|
| Quadrant | BADHDUFLAG | Total packets | Discarded packets |
| A | 0 | 317471 | 0 |
| B | 0 | 262004 | 0 |
| C | 0 | 255153 | 0 |
| D | 0 | 415574 | 0 |
| Mode SS | |||
|---|---|---|---|
| Quadrant | BADHDUFLAG | Total packets | Discarded packets |
| A | 0 | 2416 | 0 |
| B | 0 | 2416 | 0 |
| C | 0 | 2416 | 0 |
| D | 0 | 2416 | 0 |
| Quadrant | Total seconds | Saturated seconds | Saturation percentage |
|---|---|---|---|
| A | 118870 | 8302 | 6.984100% |
| B | 118870 | 1981 | 1.666526% |
| C | 118870 | 1876 | 1.578195% |
| D | 118870 | 11927 | 10.033650% |
Noise dominated data is calculated using 1-second bins in cleaned event files. If a bin has >2000 counts, and if more than 50% of those come from <1% of pixels, then it is considered to be noise-dominated and hence unusable.
| Quadrant | # 1 sec bins | Bins with >0 counts | Bins with >2000 counts | High rate bins dominated by noise | Noise dominated (total time) | Noise dominated (detector-on time) | Marked lightcurve |
|---|---|---|---|---|---|---|---|
| A | 137195 | 118855 | 598 | 598 | 0.44% | 0.50% |  |
| B | 137195 | 118873 | 68 | 68 | 0.05% | 0.06% |  |
| C | 137195 | 118867 | 18 | 18 | 0.01% | 0.02% |  |
| D | 137195 | 118855 | 1788 | 1788 | 1.30% | 1.50% |  |
Top three noisy pixels from each quadrant. If the there are fewer than three noisy pixels in the level2.evt file, extra rows are filled as -1
| Pixel properties | Quadrant properties | ||||||
|---|---|---|---|---|---|---|---|
| Quadrant | DetID | PixID | Counts | Sigma | Mean | Median | Sigma |
| A | 15 | 174 | 14349907 | 10712.58 | 6218 | 6119 | 1339.0 |
| A | 0 | 23 | 2117479 | 1576.86 | 6218 | 6119 | 1339.0 |
| A | 10 | 234 | 224489 | 163.09 | 6218 | 6119 | 1339.0 |
| B | 15 | 35 | 1146478 | 956.44 | 6442 | 6299 | 1192.1 |
| B | 10 | 16 | 553262 | 458.82 | 6442 | 6299 | 1192.1 |
| B | 0 | 189 | 451571 | 373.51 | 6442 | 6299 | 1192.1 |
| C | 3 | 233 | 1614526 | 1124.98 | 6125 | 6107 | 1429.7 |
| C | 0 | 207 | 1325535 | 922.85 | 6125 | 6107 | 1429.7 |
| C | 7 | 247 | 393479 | 270.94 | 6125 | 6107 | 1429.7 |
| D | 1 | 52 | 31366899 | 22227.9 | 6008 | 5813 | 1410.9 |
| D | 2 | 16 | 6346899 | 4494.39 | 6008 | 5813 | 1410.9 |
| D | 15 | 0 | 2223212 | 1571.63 | 6008 | 5813 | 1410.9 |
Histogram calculated using DETX and DETY for each event in the final _common_clean file
| Quadrant A |  |
 |
Quadrant B |
|---|---|---|---|
| Quadrant D |  |
 |
Quadrant C |
| Plot type | Count rate plots | Images |
|---|---|---|
| Comparison with Poisson distribution Blue bars denote a histogram of data divided into 1 sec bins. Red curve is a Poisson curve with rate = median count rate of data. |
 |
 |
| Quadrant-wise count rates Data is divided into 100 sec bins |
 |
|
| Module-wise count rates for Quadrant A Data is divided into 100 sec bins |
 |
 |
| Module-wise count rates for Quadrant B Data is divided into 100 sec bins |
 |
 |
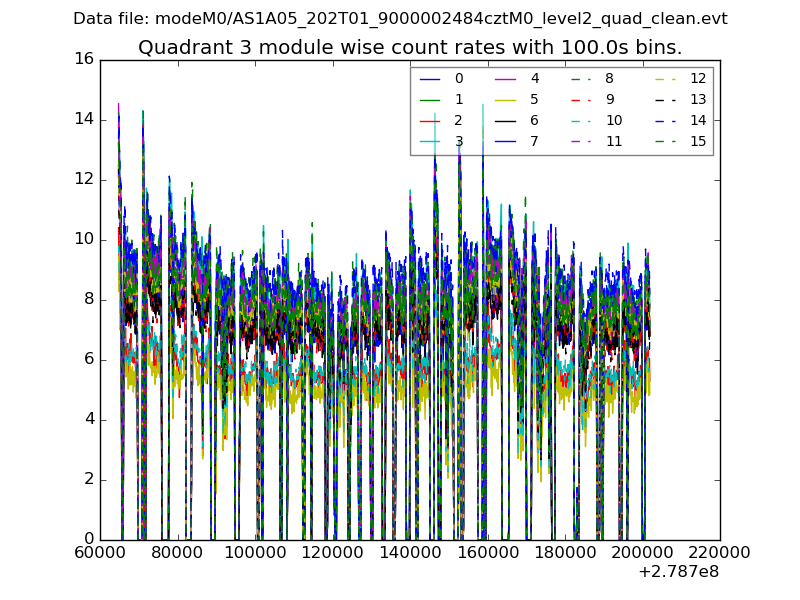
| Module-wise count rates for Quadrant C Data is divided into 100 sec bins |
 |
 |
| Module-wise count rates for Quadrant D Data is divided into 100 sec bins |
 |
 |
| Parameter | Plot |
|---|---|
| CZT HV Monitor |  |
| D_VDD |  |
| Temperature 1 |  |
| Veto HV Monitor |  |
| Veto LLD |  |
| Alpha Counter |  |
| _CPM_Rate |  |
| CZT Counter |  |
| +2.5 Volts monitor |  |
| +5 Volts monitor |  |
| _ROLL_ROT |  |
| _Roll_DEC |  |
| _Roll_RA | 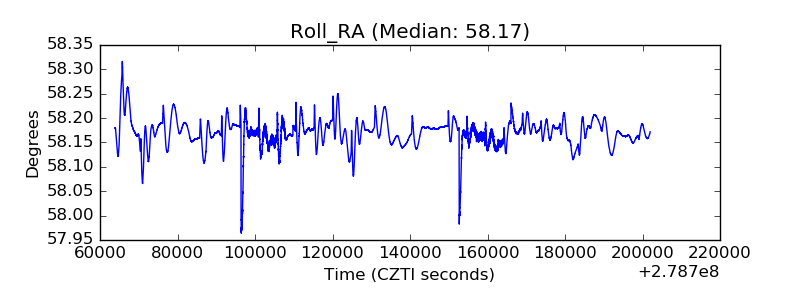 |
| Veto Counter |  |