| Param | Original file | Final file |
|---|---|---|
| Filename | modeM0/AS1A05_059T07_9000002480cztM0_level2_bc.evt | modeM0/AS1A05_059T07_9000002480cztM0_level2_quad_clean.evt |
| Size (bytes) | 743,532,480 | 337,366,080 |
| Size | 709.1 MB | 321.7 MB |
| Events in quadrant A | 7,281,653 | 2,205,250 |
| Events in quadrant B | 4,597,891 | 2,302,699 |
| Events in quadrant C | 3,991,186 | 2,242,978 |
| Events in quadrant D | 5,370,544 | 2,182,850 |
| Mode SS | |||
|---|---|---|---|
| Quadrant | BADHDUFLAG | Total packets | Discarded packets |
| A | 0 | 376 | 0 |
| B | 0 | 376 | 0 |
| C | 0 | 376 | 0 |
| D | 0 | 376 | 0 |
| Mode M0 | |||
|---|---|---|---|
| Quadrant | BADHDUFLAG | Total packets | Discarded packets |
| A | 0 | 52416 | 0 |
| B | 0 | 41260 | 0 |
| C | 0 | 39139 | 0 |
| D | 0 | 43488 | 0 |
| Mode M9 | |||
|---|---|---|---|
| Quadrant | BADHDUFLAG | Total packets | Discarded packets |
| A | 0 | 19 | 0 |
| B | 0 | 19 | 0 |
| C | 0 | 19 | 0 |
| D | 0 | 19 | 0 |
| Quadrant | Total seconds | Saturated seconds | Saturation percentage |
|---|---|---|---|
| A | 18657 | 1395 | 7.477086% |
| B | 18657 | 365 | 1.956370% |
| C | 18657 | 275 | 1.473978% |
| D | 18657 | 493 | 2.642440% |
Noise dominated data is calculated using 1-second bins in cleaned event files. If a bin has >2000 counts, and if more than 50% of those come from <1% of pixels, then it is considered to be noise-dominated and hence unusable.
| Quadrant | # 1 sec bins | Bins with >0 counts | Bins with >2000 counts | High rate bins dominated by noise | Noise dominated (total time) | Noise dominated (detector-on time) | Marked lightcurve |
|---|---|---|---|---|---|---|---|
| A | 20448 | 18654 | 128 | 128 | 0.63% | 0.69% |  |
| B | 20448 | 18658 | 18 | 18 | 0.09% | 0.10% |  |
| C | 20448 | 18659 | 2 | 2 | 0.01% | 0.01% | 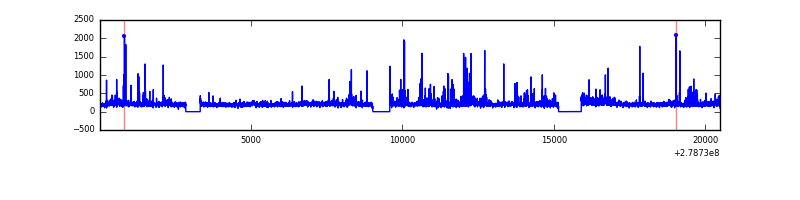 |
| D | 20448 | 18658 | 38 | 38 | 0.19% | 0.20% |  |
Top three noisy pixels from each quadrant. If the there are fewer than three noisy pixels in the level2.evt file, extra rows are filled as -1
| Pixel properties | Quadrant properties | ||||||
|---|---|---|---|---|---|---|---|
| Quadrant | DetID | PixID | Counts | Sigma | Mean | Median | Sigma |
| A | 15 | 174 | 3647082 | 18258.45 | 893 | 874 | 199.7 |
| A | 10 | 234 | 109154 | 542.21 | 893 | 874 | 199.7 |
| A | 15 | 190 | 51765 | 254.84 | 893 | 874 | 199.7 |
| B | 15 | 35 | 424823 | 2362.35 | 922 | 898 | 179.5 |
| B | 10 | 16 | 230756 | 1280.9 | 922 | 898 | 179.5 |
| B | 15 | 36 | 78525 | 432.58 | 922 | 898 | 179.5 |
| C | 0 | 207 | 295898 | 1391.47 | 892 | 885 | 212.0 |
| C | 3 | 233 | 247318 | 1162.34 | 892 | 885 | 212.0 |
| C | 7 | 247 | 16310 | 72.75 | 892 | 885 | 212.0 |
| D | 10 | 70 | 489696 | 2278.4 | 904 | 871 | 214.5 |
| D | 1 | 52 | 438009 | 2037.49 | 904 | 871 | 214.5 |
| D | 2 | 16 | 294718 | 1369.61 | 904 | 871 | 214.5 |
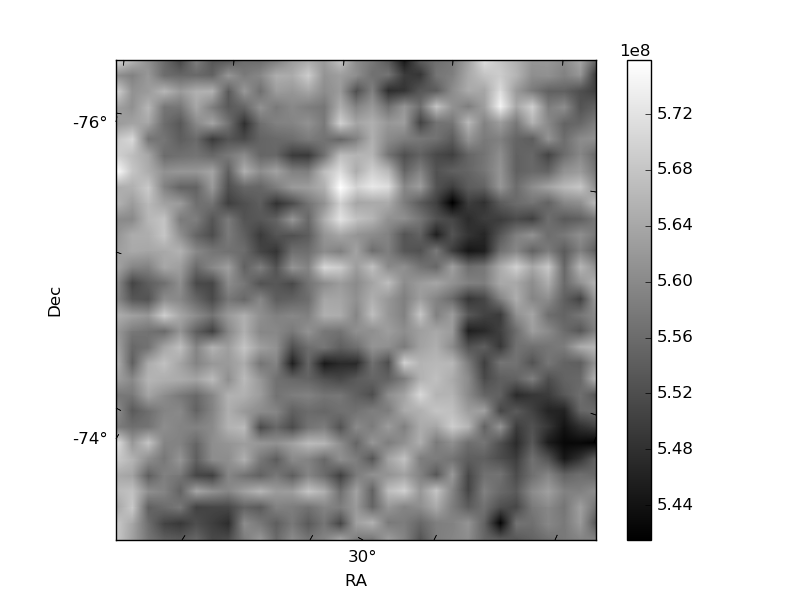
Histogram calculated using DETX and DETY for each event in the final _common_clean file
| Quadrant A |  |
 |
Quadrant B |
|---|---|---|---|
| Quadrant D |  |
 |
Quadrant C |
| Plot type | Count rate plots | Images |
|---|---|---|
| Comparison with Poisson distribution Blue bars denote a histogram of data divided into 1 sec bins. Red curve is a Poisson curve with rate = median count rate of data. |
 |
 |
| Quadrant-wise count rates Data is divided into 100 sec bins |
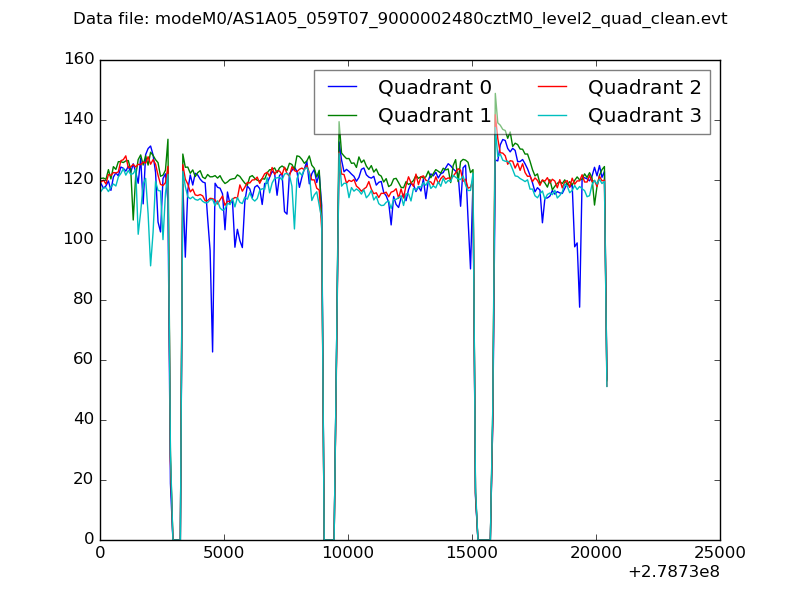 |
|
| Module-wise count rates for Quadrant A Data is divided into 100 sec bins |
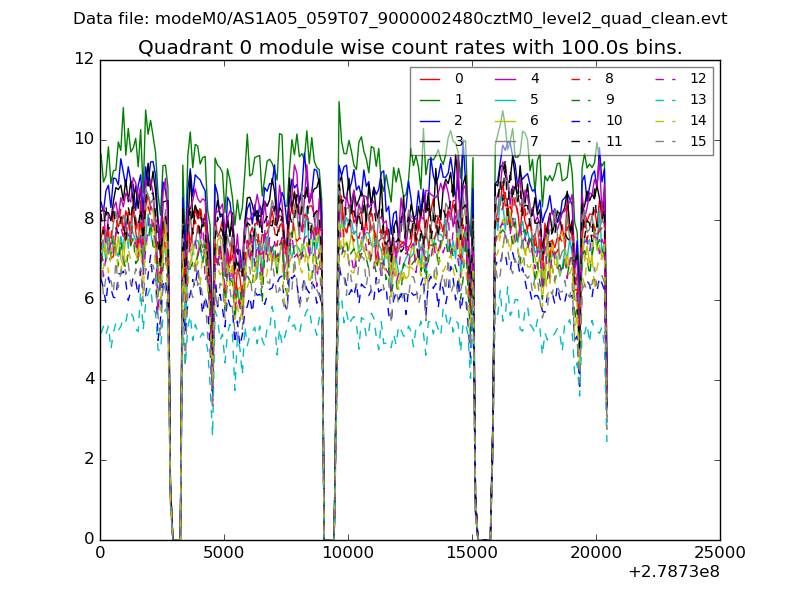 |
 |
| Module-wise count rates for Quadrant B Data is divided into 100 sec bins |
 |
 |
| Module-wise count rates for Quadrant C Data is divided into 100 sec bins |
 |
 |
| Module-wise count rates for Quadrant D Data is divided into 100 sec bins |
 |
 |
| Parameter | Plot |
|---|---|
| CZT HV Monitor | 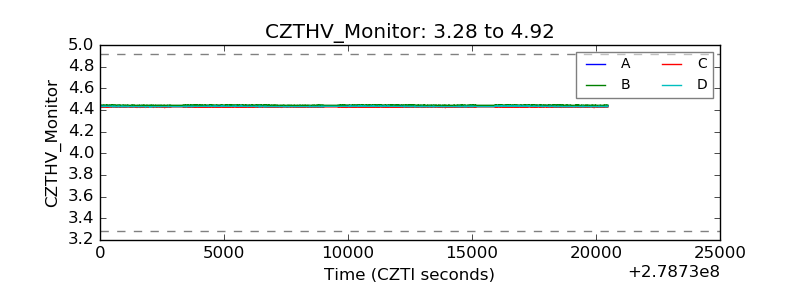 |
| D_VDD |  |
| Temperature 1 | 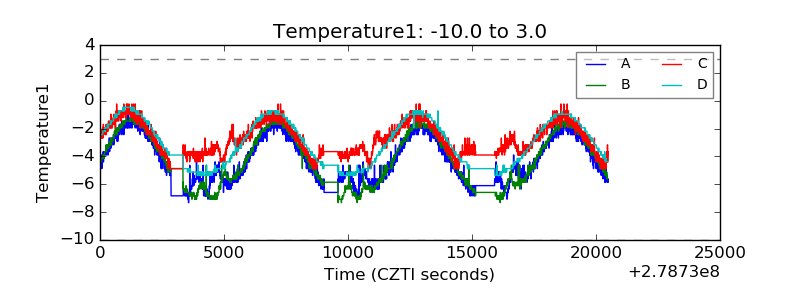 |
| Veto HV Monitor |  |
| Veto LLD |  |
| Alpha Counter |  |
| _CPM_Rate |  |
| CZT Counter |  |
| +2.5 Volts monitor |  |
| +5 Volts monitor |  |
| _ROLL_ROT |  |
| _Roll_DEC | 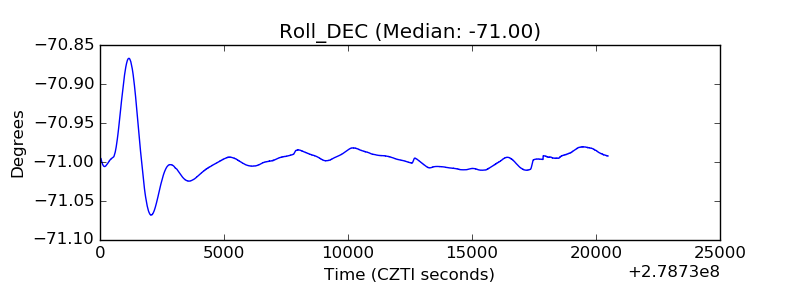 |
| _Roll_RA |  |
| Veto Counter |  |