| Param | Original file | Final file |
|---|---|---|
| Filename | modeM0/AS1A05_059T05_9000002478cztM0_level2_bc.evt | modeM0/AS1A05_059T05_9000002478cztM0_level2_quad_clean.evt |
| Size (bytes) | 686,511,360 | 333,584,640 |
| Size | 654.7 MB | 318.1 MB |
| Events in quadrant A | 5,491,271 | 2,217,264 |
| Events in quadrant B | 4,234,678 | 2,291,696 |
| Events in quadrant C | 4,596,792 | 2,186,863 |
| Events in quadrant D | 5,219,568 | 2,151,846 |
| Mode M9 | |||
|---|---|---|---|
| Quadrant | BADHDUFLAG | Total packets | Discarded packets |
| A | 0 | 11 | 0 |
| B | 0 | 11 | 0 |
| C | 0 | 11 | 0 |
| D | 0 | 11 | 0 |
| Mode SS | |||
|---|---|---|---|
| Quadrant | BADHDUFLAG | Total packets | Discarded packets |
| A | 0 | 374 | 0 |
| B | 0 | 374 | 0 |
| C | 0 | 374 | 0 |
| D | 0 | 374 | 0 |
| Mode M0 | |||
|---|---|---|---|
| Quadrant | BADHDUFLAG | Total packets | Discarded packets |
| A | 0 | 45178 | 0 |
| B | 0 | 38946 | 0 |
| C | 0 | 41273 | 0 |
| D | 0 | 42129 | 0 |
| Quadrant | Total seconds | Saturated seconds | Saturation percentage |
|---|---|---|---|
| A | 18226 | 879 | 4.822781% |
| B | 18226 | 167 | 0.916273% |
| C | 18226 | 245 | 1.344234% |
| D | 18226 | 223 | 1.223527% |
Noise dominated data is calculated using 1-second bins in cleaned event files. If a bin has >2000 counts, and if more than 50% of those come from <1% of pixels, then it is considered to be noise-dominated and hence unusable.
| Quadrant | # 1 sec bins | Bins with >0 counts | Bins with >2000 counts | High rate bins dominated by noise | Noise dominated (total time) | Noise dominated (detector-on time) | Marked lightcurve |
|---|---|---|---|---|---|---|---|
| A | 19417 | 18227 | 62 | 62 | 0.32% | 0.34% |  |
| B | 19417 | 18228 | 4 | 4 | 0.02% | 0.02% | 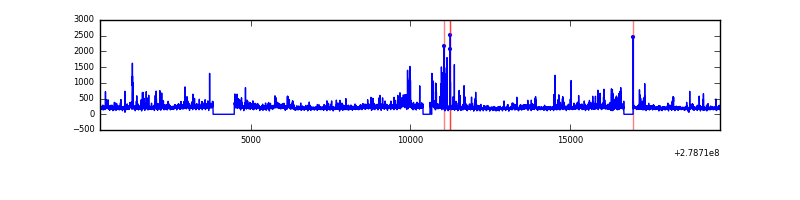 |
| C | 19417 | 18227 | 16 | 16 | 0.08% | 0.09% | 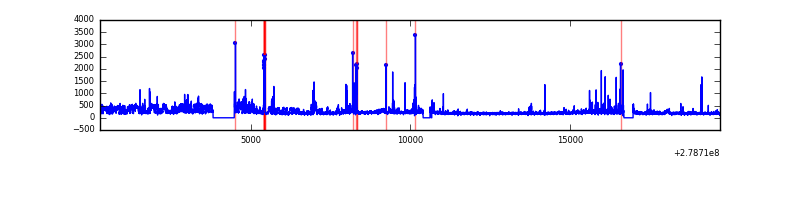 |
| D | 19417 | 18227 | 16 | 16 | 0.08% | 0.09% |  |
Top three noisy pixels from each quadrant. If the there are fewer than three noisy pixels in the level2.evt file, extra rows are filled as -1
| Pixel properties | Quadrant properties | ||||||
|---|---|---|---|---|---|---|---|
| Quadrant | DetID | PixID | Counts | Sigma | Mean | Median | Sigma |
| A | 15 | 174 | 1956055 | 9810.99 | 891 | 872 | 199.3 |
| A | 9 | 143 | 91560 | 455.07 | 891 | 872 | 199.3 |
| A | 3 | 1 | 18070 | 86.3 | 891 | 872 | 199.3 |
| B | 15 | 35 | 196045 | 1105.51 | 916 | 894 | 176.5 |
| B | 0 | 229 | 123102 | 692.3 | 916 | 894 | 176.5 |
| B | 10 | 16 | 63175 | 352.82 | 916 | 894 | 176.5 |
| C | 3 | 233 | 899425 | 4356.06 | 872 | 868 | 206.3 |
| C | 0 | 207 | 301696 | 1458.37 | 872 | 868 | 206.3 |
| C | 7 | 247 | 25637 | 120.08 | 872 | 868 | 206.3 |
| D | 2 | 16 | 578043 | 2688.09 | 894 | 862 | 214.7 |
| D | 1 | 52 | 471899 | 2193.75 | 894 | 862 | 214.7 |
| D | 11 | 176 | 185952 | 862.01 | 894 | 862 | 214.7 |
Histogram calculated using DETX and DETY for each event in the final _common_clean file
| Quadrant A |  |
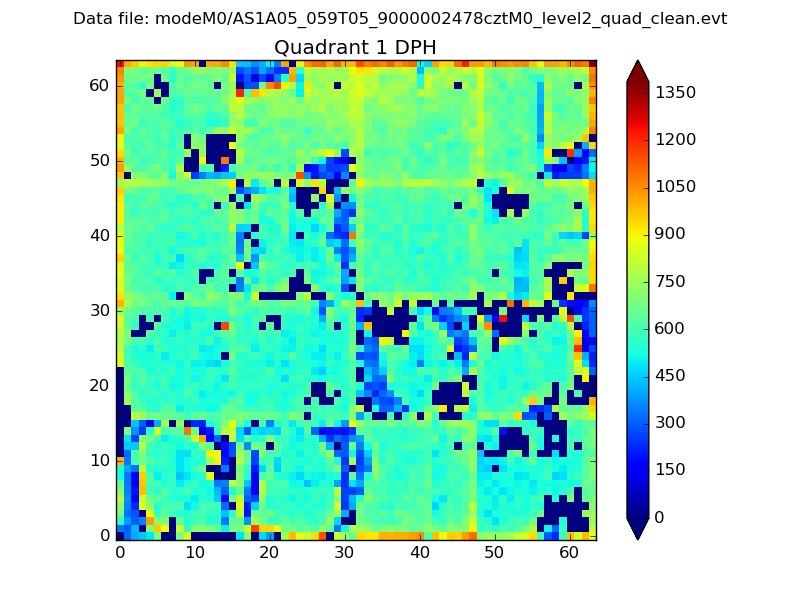 |
Quadrant B |
|---|---|---|---|
| Quadrant D |  |
 |
Quadrant C |
| Plot type | Count rate plots | Images |
|---|---|---|
| Comparison with Poisson distribution Blue bars denote a histogram of data divided into 1 sec bins. Red curve is a Poisson curve with rate = median count rate of data. |
 |
 |
| Quadrant-wise count rates Data is divided into 100 sec bins |
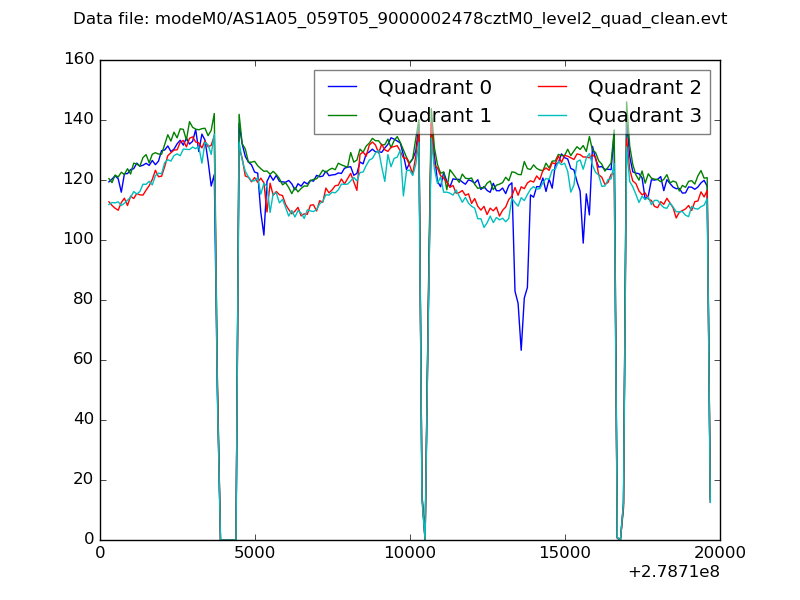 |
|
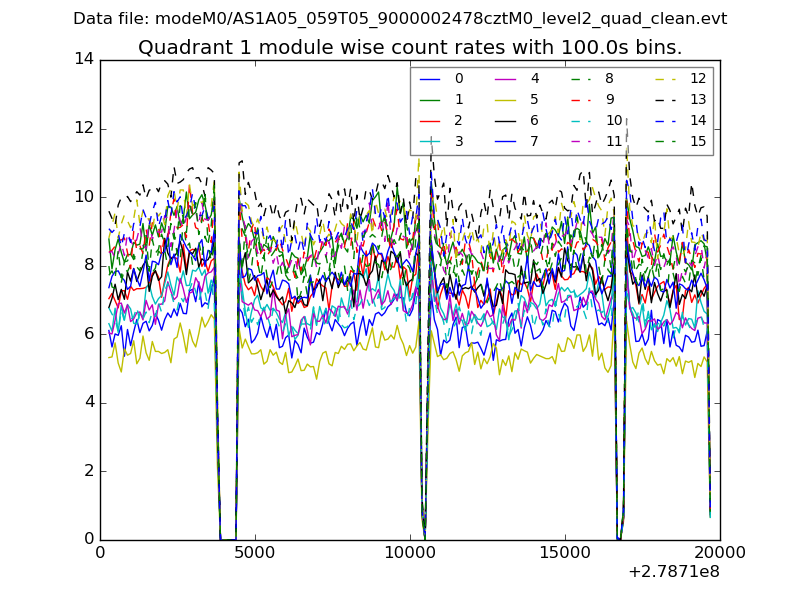
| Module-wise count rates for Quadrant A Data is divided into 100 sec bins |
 |
 |
| Module-wise count rates for Quadrant B Data is divided into 100 sec bins |
 |
 |
| Module-wise count rates for Quadrant C Data is divided into 100 sec bins |
 |
 |
| Module-wise count rates for Quadrant D Data is divided into 100 sec bins |
 |
 |
| Parameter | Plot |
|---|---|
| CZT HV Monitor |  |
| D_VDD |  |
| Temperature 1 |  |
| Veto HV Monitor |  |
| Veto LLD | 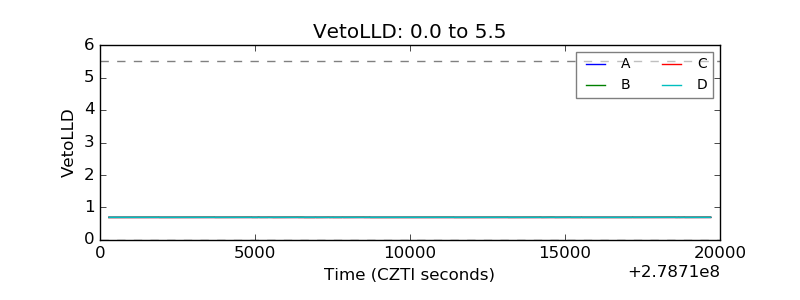 |
| Alpha Counter |  |
| _CPM_Rate |  |
| CZT Counter | 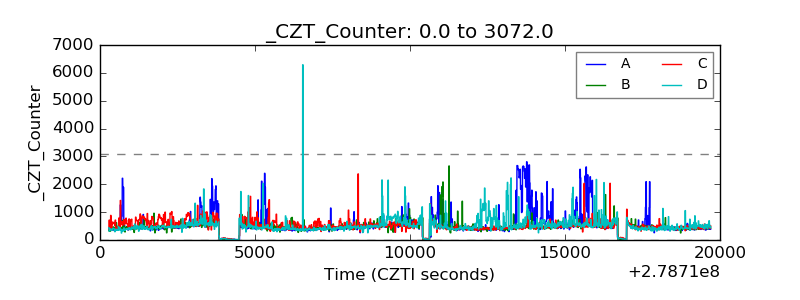 |
| +2.5 Volts monitor |  |
| +5 Volts monitor |  |
| _ROLL_ROT |  |
| _Roll_DEC | 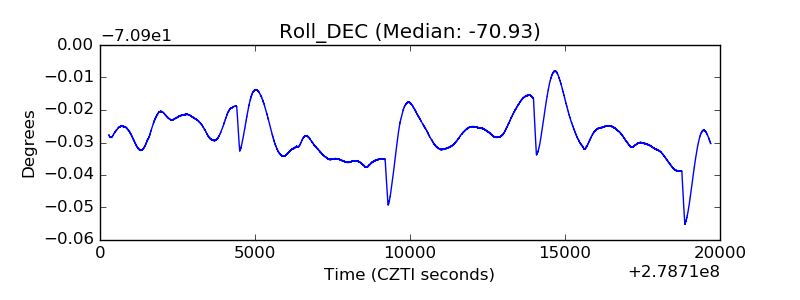 |
| _Roll_RA |  |
| Veto Counter |  |