| Param | Original file | Final file |
|---|---|---|
| Filename | modeM0/AS1A05_059T04_9000002476cztM0_level2_bc.evt | modeM0/AS1A05_059T04_9000002476cztM0_level2_quad_clean.evt |
| Size (bytes) | 411,163,200 | 178,128,000 |
| Size | 392.1 MB | 169.9 MB |
| Events in quadrant A | 3,355,781 | 1,199,194 |
| Events in quadrant B | 2,452,782 | 1,239,195 |
| Events in quadrant C | 3,205,269 | 1,167,517 |
| Events in quadrant D | 2,812,320 | 1,158,508 |
| Mode M9 | |||
|---|---|---|---|
| Quadrant | BADHDUFLAG | Total packets | Discarded packets |
| A | 0 | 23 | 0 |
| B | 0 | 23 | 0 |
| C | 0 | 23 | 0 |
| D | 0 | 23 | 0 |
| Mode M0 | |||
|---|---|---|---|
| Quadrant | BADHDUFLAG | Total packets | Discarded packets |
| A | 0 | 24870 | 0 |
| B | 0 | 20689 | 0 |
| C | 0 | 24087 | 0 |
| D | 0 | 21429 | 0 |
| Mode SS | |||
|---|---|---|---|
| Quadrant | BADHDUFLAG | Total packets | Discarded packets |
| A | 0 | 186 | 0 |
| B | 0 | 186 | 0 |
| C | 0 | 186 | 0 |
| D | 0 | 186 | 0 |
| Quadrant | Total seconds | Saturated seconds | Saturation percentage |
|---|---|---|---|
| A | 9092 | 541 | 5.950286% |
| B | 9092 | 160 | 1.759789% |
| C | 9092 | 242 | 2.661681% |
| D | 9092 | 138 | 1.517818% |
Noise dominated data is calculated using 1-second bins in cleaned event files. If a bin has >2000 counts, and if more than 50% of those come from <1% of pixels, then it is considered to be noise-dominated and hence unusable.
| Quadrant | # 1 sec bins | Bins with >0 counts | Bins with >2000 counts | High rate bins dominated by noise | Noise dominated (total time) | Noise dominated (detector-on time) | Marked lightcurve |
|---|---|---|---|---|---|---|---|
| A | 11383 | 9093 | 12 | 12 | 0.11% | 0.13% | 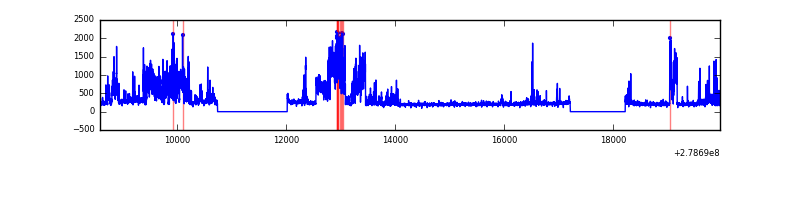 |
| B | 11383 | 9093 | 3 | 3 | 0.03% | 0.03% |  |
| C | 11383 | 9093 | 13 | 13 | 0.11% | 0.14% | 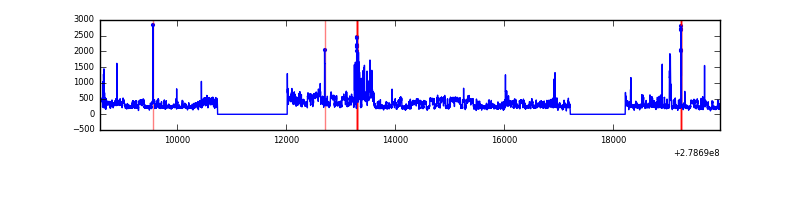 |
| D | 11383 | 9093 | 6 | 6 | 0.05% | 0.07% |  |
Top three noisy pixels from each quadrant. If the there are fewer than three noisy pixels in the level2.evt file, extra rows are filled as -1
| Pixel properties | Quadrant properties | ||||||
|---|---|---|---|---|---|---|---|
| Quadrant | DetID | PixID | Counts | Sigma | Mean | Median | Sigma |
| A | 15 | 174 | 1389914 | 12855.45 | 482 | 474 | 108.1 |
| A | 10 | 234 | 96566 | 889.07 | 482 | 474 | 108.1 |
| A | 9 | 143 | 13704 | 122.41 | 482 | 474 | 108.1 |
| B | 15 | 35 | 137582 | 1436.03 | 495 | 484 | 95.5 |
| B | 3 | 209 | 97988 | 1021.3 | 495 | 484 | 95.5 |
| B | 0 | 229 | 90777 | 945.77 | 495 | 484 | 95.5 |
| C | 3 | 233 | 1099745 | 9849.97 | 466 | 464 | 111.6 |
| C | 0 | 207 | 247054 | 2209.54 | 466 | 464 | 111.6 |
| C | 7 | 247 | 67438 | 600.11 | 466 | 464 | 111.6 |
| D | 1 | 52 | 583275 | 5128.81 | 479 | 463 | 113.6 |
| D | 10 | 70 | 190330 | 1670.85 | 479 | 463 | 113.6 |
| D | 11 | 176 | 76252 | 666.95 | 479 | 463 | 113.6 |
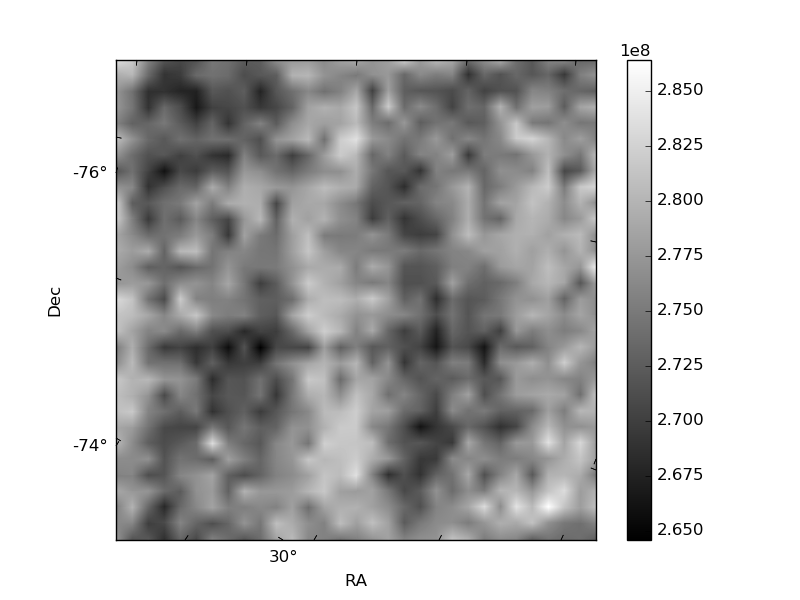
Histogram calculated using DETX and DETY for each event in the final _common_clean file
| Quadrant A |  |
 |
Quadrant B |
|---|---|---|---|
| Quadrant D |  |
 |
Quadrant C |
| Plot type | Count rate plots | Images |
|---|---|---|
| Comparison with Poisson distribution Blue bars denote a histogram of data divided into 1 sec bins. Red curve is a Poisson curve with rate = median count rate of data. |
 |
 |
| Quadrant-wise count rates Data is divided into 100 sec bins |
 |
|
| Module-wise count rates for Quadrant A Data is divided into 100 sec bins |
 |
 |
| Module-wise count rates for Quadrant B Data is divided into 100 sec bins |
 |
 |
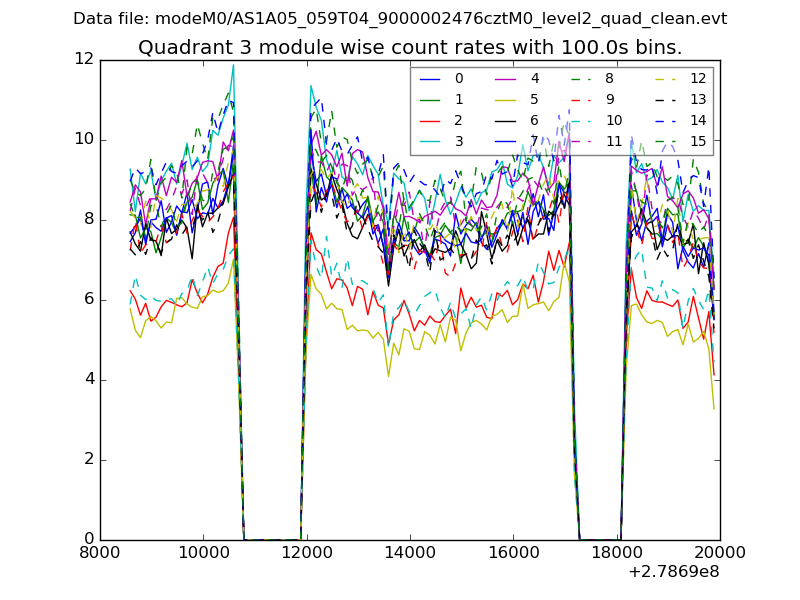
| Module-wise count rates for Quadrant C Data is divided into 100 sec bins |
 |
 |
| Module-wise count rates for Quadrant D Data is divided into 100 sec bins |
 |
 |
| Parameter | Plot |
|---|---|
| CZT HV Monitor |  |
| D_VDD | 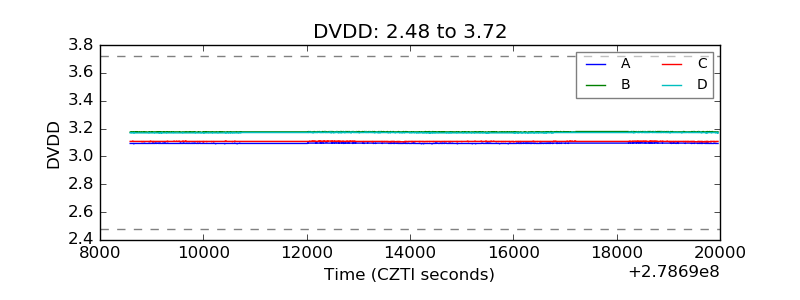 |
| Temperature 1 |  |
| Veto HV Monitor |  |
| Veto LLD |  |
| Alpha Counter |  |
| _CPM_Rate |  |
| CZT Counter |  |
| +2.5 Volts monitor |  |
| +5 Volts monitor |  |
| _ROLL_ROT |  |
| _Roll_DEC |  |
| _Roll_RA |  |
| Veto Counter |  |