| Param | Original file | Final file |
|---|---|---|
| Filename | modeM0/AS1A05_059T03_9000002474cztM0_level2_bc.evt | modeM0/AS1A05_059T03_9000002474cztM0_level2_quad_clean.evt |
| Size (bytes) | 353,373,120 | 158,906,880 |
| Size | 337.0 MB | 151.5 MB |
| Events in quadrant A | 2,389,917 | 1,096,022 |
| Events in quadrant B | 2,224,203 | 1,125,700 |
| Events in quadrant C | 2,015,930 | 1,067,371 |
| Events in quadrant D | 3,563,562 | 1,011,551 |
| Mode SS | |||
|---|---|---|---|
| Quadrant | BADHDUFLAG | Total packets | Discarded packets |
| A | 0 | 150 | 0 |
| B | 0 | 150 | 0 |
| C | 0 | 150 | 0 |
| D | 0 | 150 | 0 |
| Mode M0 | |||
|---|---|---|---|
| Quadrant | BADHDUFLAG | Total packets | Discarded packets |
| A | 0 | 18840 | 0 |
| B | 0 | 17519 | 0 |
| C | 0 | 17048 | 0 |
| D | 0 | 22014 | 0 |
| Mode M9 | |||
|---|---|---|---|
| Quadrant | BADHDUFLAG | Total packets | Discarded packets |
| A | 0 | 18 | 0 |
| B | 0 | 18 | 0 |
| C | 0 | 18 | 0 |
| D | 0 | 18 | 0 |
| Quadrant | Total seconds | Saturated seconds | Saturation percentage |
|---|---|---|---|
| A | 7358 | 299 | 4.063604% |
| B | 7358 | 114 | 1.549334% |
| C | 7358 | 132 | 1.793966% |
| D | 7358 | 528 | 7.175863% |
Noise dominated data is calculated using 1-second bins in cleaned event files. If a bin has >2000 counts, and if more than 50% of those come from <1% of pixels, then it is considered to be noise-dominated and hence unusable.
| Quadrant | # 1 sec bins | Bins with >0 counts | Bins with >2000 counts | High rate bins dominated by noise | Noise dominated (total time) | Noise dominated (detector-on time) | Marked lightcurve |
|---|---|---|---|---|---|---|---|
| A | 8713 | 7357 | 6 | 6 | 0.07% | 0.08% |  |
| B | 8713 | 7358 | 2 | 2 | 0.02% | 0.03% |  |
| C | 8714 | 7359 | 6 | 6 | 0.07% | 0.08% | 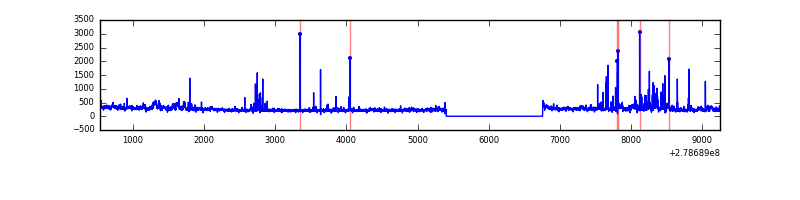 |
| D | 8713 | 7358 | 40 | 40 | 0.46% | 0.54% | 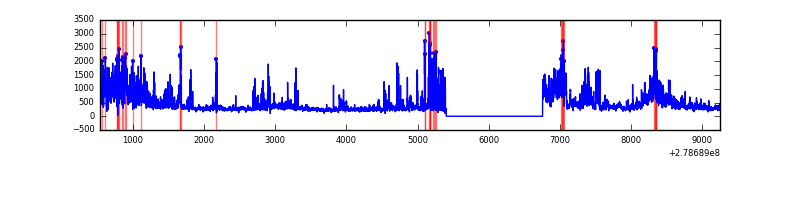 |
Top three noisy pixels from each quadrant. If the there are fewer than three noisy pixels in the level2.evt file, extra rows are filled as -1
| Pixel properties | Quadrant properties | ||||||
|---|---|---|---|---|---|---|---|
| Quadrant | DetID | PixID | Counts | Sigma | Mean | Median | Sigma |
| A | 15 | 174 | 666407 | 6877.97 | 443 | 438 | 96.8 |
| A | 9 | 143 | 11755 | 116.87 | 443 | 438 | 96.8 |
| A | 13 | 248 | 4578 | 42.75 | 443 | 438 | 96.8 |
| B | 0 | 229 | 102739 | 1196.98 | 453 | 445 | 85.5 |
| B | 15 | 35 | 102207 | 1190.76 | 453 | 445 | 85.5 |
| B | 0 | 189 | 50847 | 589.77 | 453 | 445 | 85.5 |
| C | 3 | 233 | 191830 | 1917.58 | 425 | 426 | 99.8 |
| C | 0 | 207 | 142770 | 1426.08 | 425 | 426 | 99.8 |
| C | 7 | 247 | 47192 | 468.53 | 425 | 426 | 99.8 |
| D | 1 | 52 | 973158 | 9841.93 | 424 | 412 | 98.8 |
| D | 5 | 222 | 540595 | 5465.4 | 424 | 412 | 98.8 |
| D | 2 | 16 | 124873 | 1259.26 | 424 | 412 | 98.8 |
Histogram calculated using DETX and DETY for each event in the final _common_clean file
| Quadrant A |  |
 |
Quadrant B |
|---|---|---|---|
| Quadrant D |  |
 |
Quadrant C |
| Plot type | Count rate plots | Images |
|---|---|---|
| Comparison with Poisson distribution Blue bars denote a histogram of data divided into 1 sec bins. Red curve is a Poisson curve with rate = median count rate of data. |
 |
 |
| Quadrant-wise count rates Data is divided into 100 sec bins |
 |
|
| Module-wise count rates for Quadrant A Data is divided into 100 sec bins |
 |
 |
| Module-wise count rates for Quadrant B Data is divided into 100 sec bins |
 |
 |
| Module-wise count rates for Quadrant C Data is divided into 100 sec bins |
 |
 |
| Module-wise count rates for Quadrant D Data is divided into 100 sec bins |
 |
 |
| Parameter | Plot |
|---|---|
| CZT HV Monitor |  |
| D_VDD |  |
| Temperature 1 | 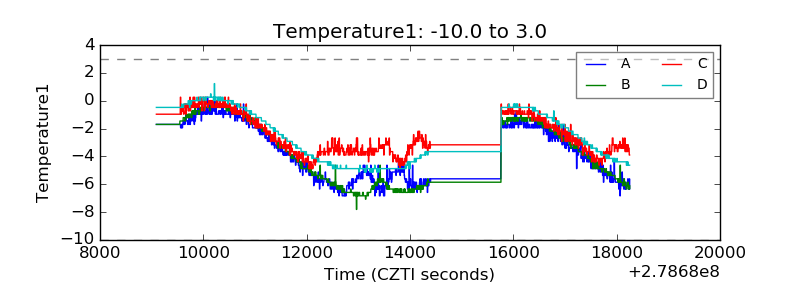 |
| Veto HV Monitor |  |
| Veto LLD |  |
| Alpha Counter |  |
| _CPM_Rate |  |
| CZT Counter |  |
| +2.5 Volts monitor |  |
| +5 Volts monitor |  |
| _ROLL_ROT |  |
| _Roll_DEC |  |
| _Roll_RA |  |
| Veto Counter |  |