| Param | Original file | Final file |
|---|---|---|
| Filename | modeM0/AS1T03_024T01_9000002472cztM0_level2_bc.evt | modeM0/AS1T03_024T01_9000002472cztM0_level2_quad_clean.evt |
| Size (bytes) | 7,411,668,480 | 1,712,335,680 |
| Size | 6.9 GB | 1.6 GB |
| Events in quadrant A | 46,756,704 | 11,237,355 |
| Events in quadrant B | 33,183,432 | 11,611,122 |
| Events in quadrant C | 31,444,070 | 11,209,420 |
| Events in quadrant D | 104,339,296 | 8,993,121 |
| Mode M9 | |||
|---|---|---|---|
| Quadrant | BADHDUFLAG | Total packets | Discarded packets |
| A | 0 | 180 | 0 |
| B | 0 | 179 | 0 |
| C | 0 | 180 | 0 |
| D | 0 | 180 | 0 |
| Mode M0 | |||
|---|---|---|---|
| Quadrant | BADHDUFLAG | Total packets | Discarded packets |
| A | 0 | 350905 | 0 |
| B | 0 | 289897 | 0 |
| C | 0 | 287043 | 0 |
| D | 0 | 602436 | 0 |
| Mode SS | |||
|---|---|---|---|
| Quadrant | BADHDUFLAG | Total packets | Discarded packets |
| A | 0 | 2614 | 0 |
| B | 0 | 2616 | 0 |
| C | 0 | 2616 | 0 |
| D | 0 | 2616 | 0 |
| Quadrant | Total seconds | Saturated seconds | Saturation percentage |
|---|---|---|---|
| A | 128504 | 9569 | 7.446461% |
| B | 128484 | 2383 | 1.854706% |
| C | 128507 | 2712 | 2.110391% |
| D | 128431 | 39833 | 31.015098% |
Noise dominated data is calculated using 1-second bins in cleaned event files. If a bin has >2000 counts, and if more than 50% of those come from <1% of pixels, then it is considered to be noise-dominated and hence unusable.
| Quadrant | # 1 sec bins | Bins with >0 counts | Bins with >2000 counts | High rate bins dominated by noise | Noise dominated (total time) | Noise dominated (detector-on time) | Marked lightcurve |
|---|---|---|---|---|---|---|---|
| A | 146787 | 128616 | 677 | 677 | 0.46% | 0.53% |  |
| B | 146787 | 128600 | 66 | 66 | 0.04% | 0.05% |  |
| C | 146787 | 128632 | 126 | 126 | 0.09% | 0.10% |  |
| D | 146787 | 128448 | 5469 | 5469 | 3.73% | 4.26% | 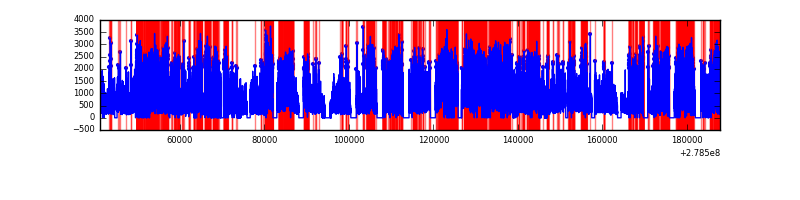 |
Top three noisy pixels from each quadrant. If the there are fewer than three noisy pixels in the level2.evt file, extra rows are filled as -1
| Pixel properties | Quadrant properties | ||||||
|---|---|---|---|---|---|---|---|
| Quadrant | DetID | PixID | Counts | Sigma | Mean | Median | Sigma |
| A | 15 | 174 | 17325053 | 11140.72 | 7031 | 6907 | 1554.5 |
| A | 12 | 96 | 949688 | 606.49 | 7031 | 6907 | 1554.5 |
| A | 9 | 143 | 880664 | 562.09 | 7031 | 6907 | 1554.5 |
| B | 15 | 35 | 1605641 | 1155.16 | 7283 | 7154 | 1383.8 |
| B | 0 | 229 | 663057 | 473.99 | 7283 | 7154 | 1383.8 |
| B | 5 | 236 | 623200 | 445.19 | 7283 | 7154 | 1383.8 |
| C | 3 | 233 | 2408728 | 1466.01 | 6987 | 7003 | 1638.3 |
| C | 0 | 207 | 1775047 | 1079.21 | 6987 | 7003 | 1638.3 |
| C | 7 | 247 | 355103 | 212.48 | 6987 | 7003 | 1638.3 |
| D | 1 | 52 | 50454843 | 35392.62 | 5952 | 5755 | 1425.4 |
| D | 2 | 16 | 24673883 | 17305.96 | 5952 | 5755 | 1425.4 |
| D | 5 | 222 | 3290195 | 2304.2 | 5952 | 5755 | 1425.4 |
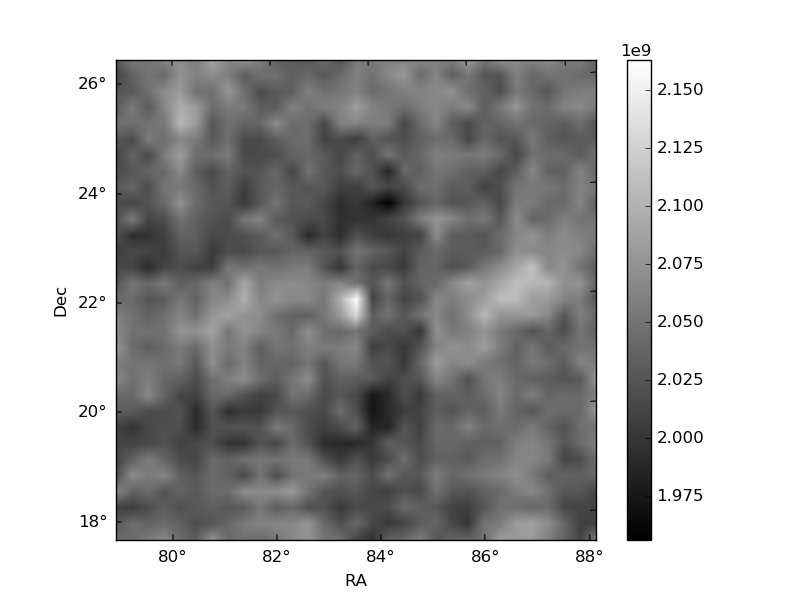
Histogram calculated using DETX and DETY for each event in the final _common_clean file
| Quadrant A |  |
 |
Quadrant B |
|---|---|---|---|
| Quadrant D |  |
 |
Quadrant C |
| Plot type | Count rate plots | Images |
|---|---|---|
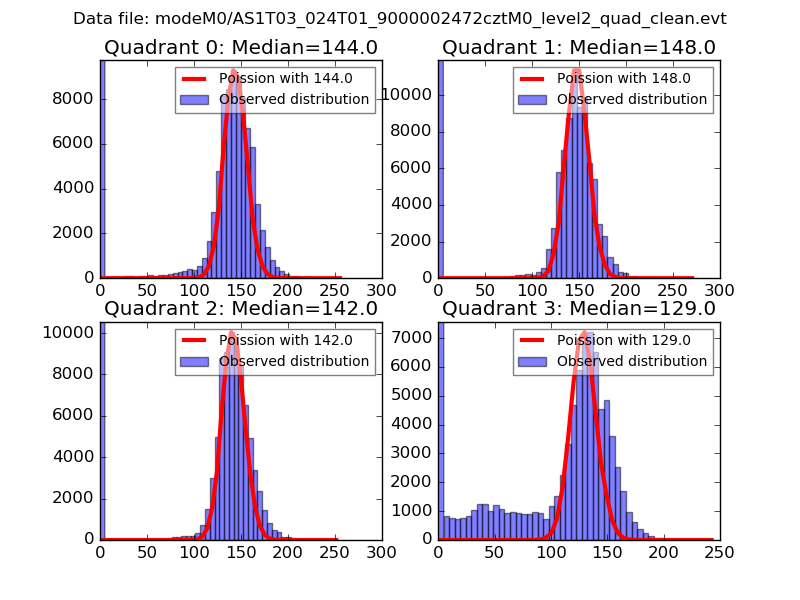
| Comparison with Poisson distribution Blue bars denote a histogram of data divided into 1 sec bins. Red curve is a Poisson curve with rate = median count rate of data. |
 |
 |
| Quadrant-wise count rates Data is divided into 100 sec bins |
 |
|
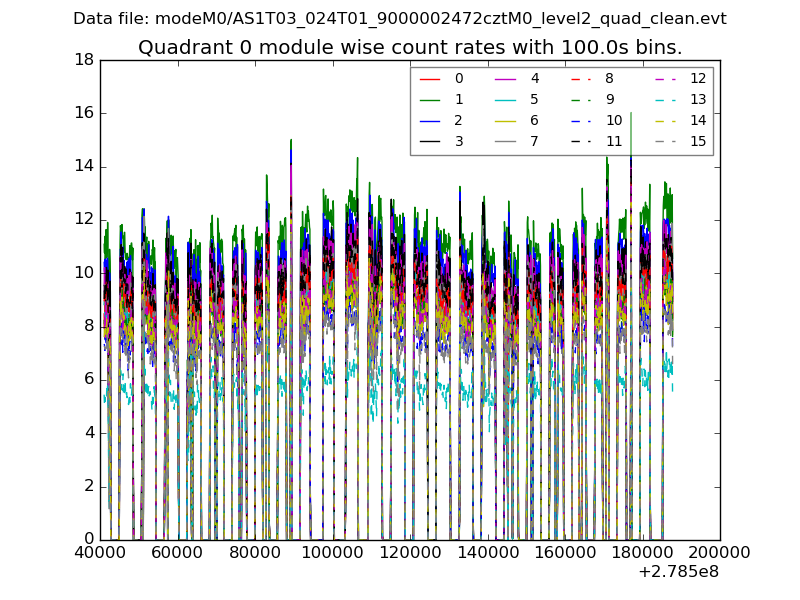
| Module-wise count rates for Quadrant A Data is divided into 100 sec bins |
 |
 |
| Module-wise count rates for Quadrant B Data is divided into 100 sec bins |
 |
 |
| Module-wise count rates for Quadrant C Data is divided into 100 sec bins |
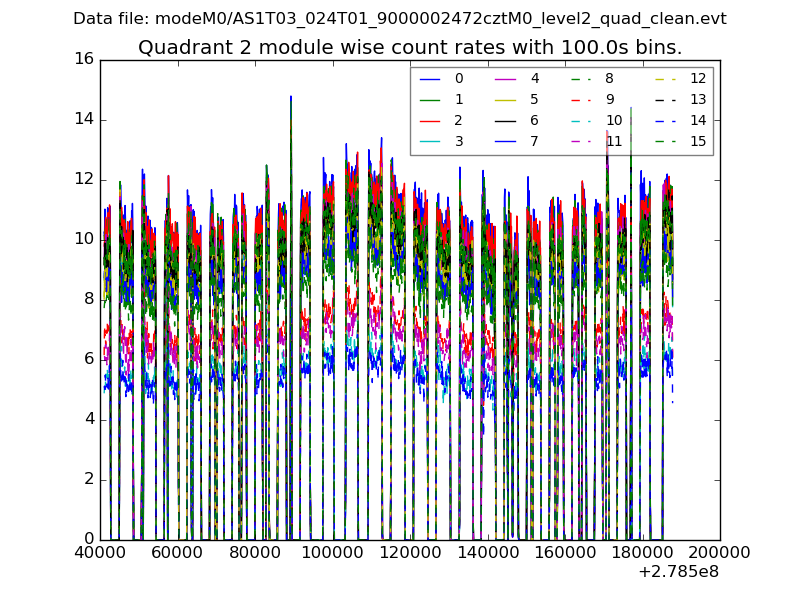 |
 |
| Module-wise count rates for Quadrant D Data is divided into 100 sec bins |
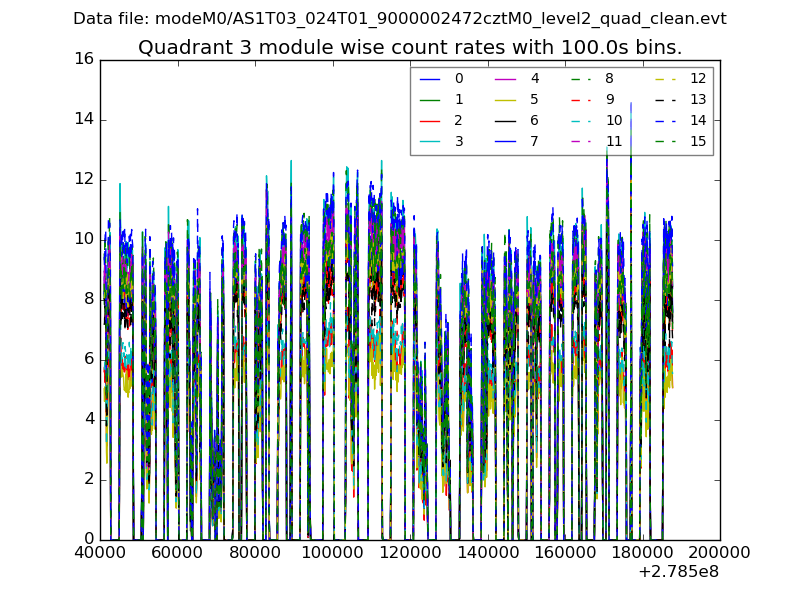 |
 |
| Parameter | Plot |
|---|---|
| CZT HV Monitor |  |
| D_VDD |  |
| Temperature 1 |  |
| Veto HV Monitor |  |
| Veto LLD |  |
| Alpha Counter |  |
| _CPM_Rate |  |
| CZT Counter | 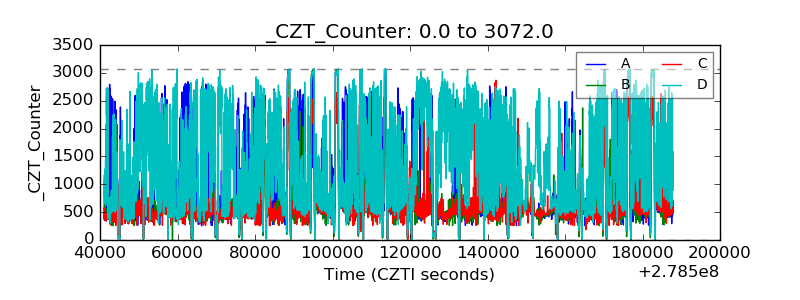 |
| +2.5 Volts monitor |  |
| +5 Volts monitor |  |
| _ROLL_ROT |  |
| _Roll_DEC | 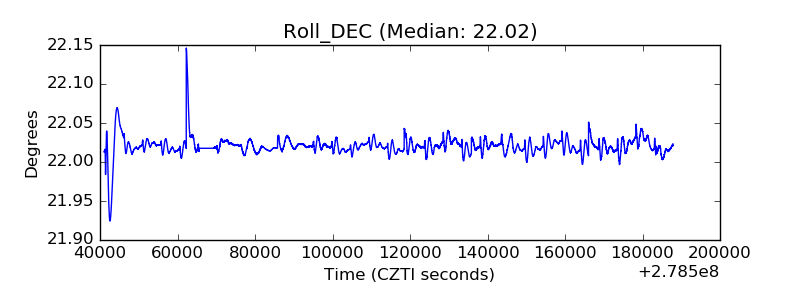 |
| _Roll_RA |  |
| Veto Counter |  |