| Param | Original file | Final file |
|---|---|---|
| Filename | modeM0/AS1A05_225T01_9000002470cztM0_level2_bc.evt | modeM0/AS1A05_225T01_9000002470cztM0_level2_quad_clean.evt |
| Size (bytes) | 386,642,880 | 85,248,000 |
| Size | 368.7 MB | 81.3 MB |
| Events in quadrant A | 3,619,706 | 489,379 |
| Events in quadrant B | 1,898,507 | 539,889 |
| Events in quadrant C | 1,633,219 | 521,342 |
| Events in quadrant D | 4,029,144 | 497,248 |
| Mode M9 | |||
|---|---|---|---|
| Quadrant | BADHDUFLAG | Total packets | Discarded packets |
| A | 0 | 22 | 0 |
| B | 0 | 22 | 0 |
| C | 0 | 22 | 0 |
| D | 0 | 22 | 0 |
| Mode SS | |||
|---|---|---|---|
| Quadrant | BADHDUFLAG | Total packets | Discarded packets |
| A | 0 | 158 | 0 |
| B | 0 | 158 | 0 |
| C | 0 | 158 | 0 |
| D | 0 | 158 | 0 |
| Mode M0 | |||
|---|---|---|---|
| Quadrant | BADHDUFLAG | Total packets | Discarded packets |
| A | 0 | 25638 | 0 |
| B | 0 | 17216 | 0 |
| C | 0 | 16378 | 0 |
| D | 0 | 24928 | 0 |
| Quadrant | Total seconds | Saturated seconds | Saturation percentage |
|---|---|---|---|
| A | 7665 | 990 | 12.915851% |
| B | 7665 | 203 | 2.648402% |
| C | 7665 | 208 | 2.713633% |
| D | 7665 | 383 | 4.996738% |
Noise dominated data is calculated using 1-second bins in cleaned event files. If a bin has >2000 counts, and if more than 50% of those come from <1% of pixels, then it is considered to be noise-dominated and hence unusable.
| Quadrant | # 1 sec bins | Bins with >0 counts | Bins with >2000 counts | High rate bins dominated by noise | Noise dominated (total time) | Noise dominated (detector-on time) | Marked lightcurve |
|---|---|---|---|---|---|---|---|
| A | 9911 | 7662 | 56 | 56 | 0.57% | 0.73% | 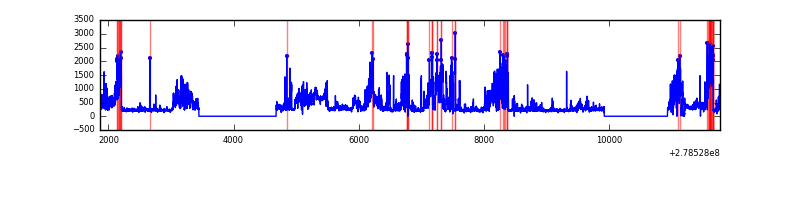 |
| B | 9911 | 7666 | 1 | 1 | 0.01% | 0.01% |  |
| C | 9911 | 7666 | 0 | 0 | 0.00% | 0.00% |  |
| D | 9911 | 7666 | 12 | 12 | 0.12% | 0.16% | 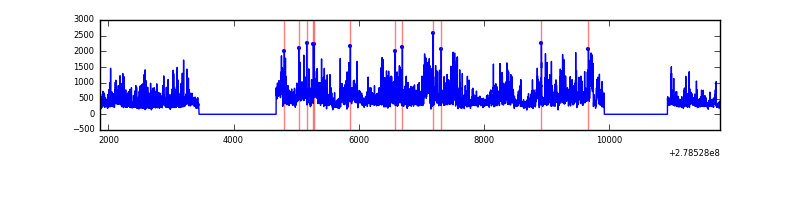 |
Top three noisy pixels from each quadrant. If the there are fewer than three noisy pixels in the level2.evt file, extra rows are filled as -1
| Pixel properties | Quadrant properties | ||||||
|---|---|---|---|---|---|---|---|
| Quadrant | DetID | PixID | Counts | Sigma | Mean | Median | Sigma |
| A | 15 | 174 | 1894351 | 21351.49 | 401 | 392 | 88.7 |
| A | 9 | 143 | 126795 | 1425.0 | 401 | 392 | 88.7 |
| A | 15 | 190 | 32493 | 361.89 | 401 | 392 | 88.7 |
| B | 15 | 35 | 76981 | 929.96 | 427 | 416 | 82.3 |
| B | 0 | 229 | 44924 | 540.59 | 427 | 416 | 82.3 |
| B | 15 | 222 | 40920 | 491.96 | 427 | 416 | 82.3 |
| C | 3 | 233 | 40247 | 408.99 | 412 | 409 | 97.4 |
| C | 7 | 247 | 4900 | 46.11 | 412 | 409 | 97.4 |
| C | 13 | 61 | 2567 | 22.15 | 412 | 409 | 97.4 |
| D | 2 | 16 | 1035570 | 10705.92 | 414 | 399 | 96.7 |
| D | 1 | 52 | 1013734 | 10480.08 | 414 | 399 | 96.7 |
| D | 5 | 222 | 282243 | 2914.88 | 414 | 399 | 96.7 |
Histogram calculated using DETX and DETY for each event in the final _common_clean file
| Quadrant A | 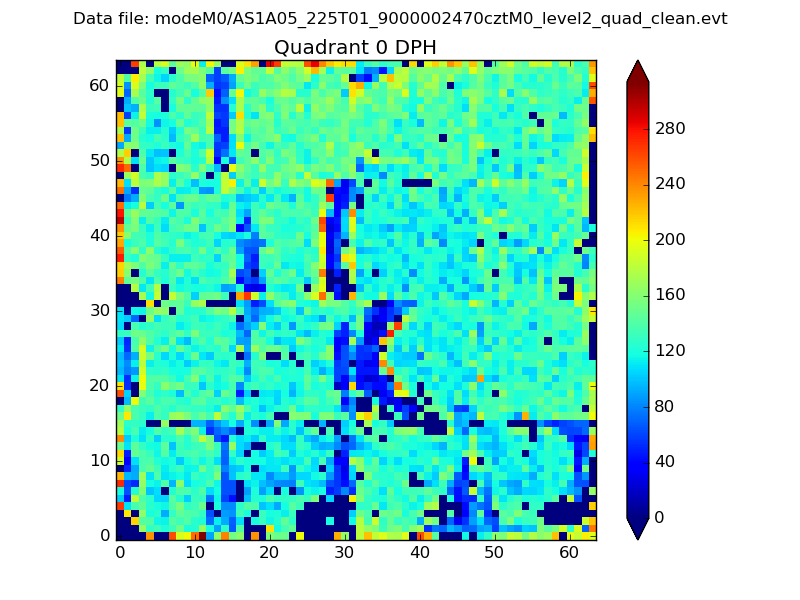 |
 |
Quadrant B |
|---|---|---|---|
| Quadrant D |  |
 |
Quadrant C |
| Plot type | Count rate plots | Images |
|---|---|---|
| Comparison with Poisson distribution Blue bars denote a histogram of data divided into 1 sec bins. Red curve is a Poisson curve with rate = median count rate of data. |
 |
 |
| Quadrant-wise count rates Data is divided into 100 sec bins |
 |
|
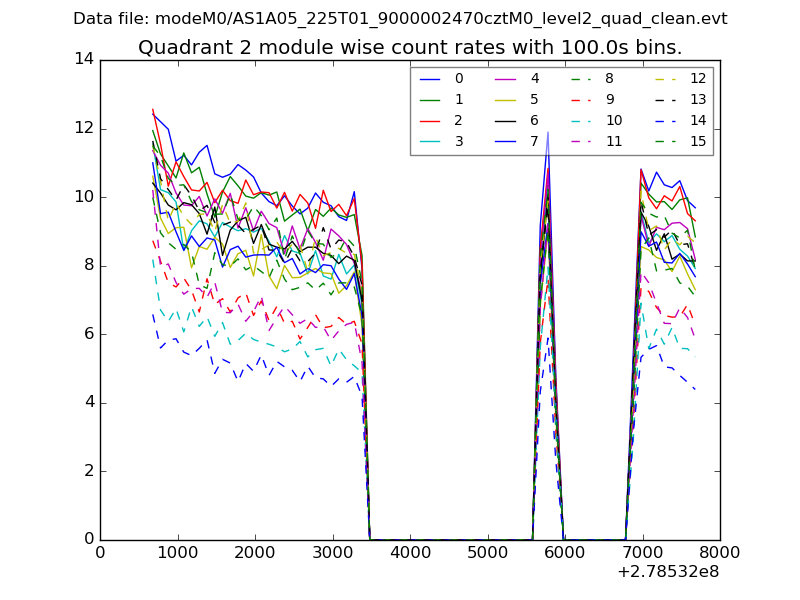
| Module-wise count rates for Quadrant A Data is divided into 100 sec bins |
 |
 |
| Module-wise count rates for Quadrant B Data is divided into 100 sec bins |
 |
 |
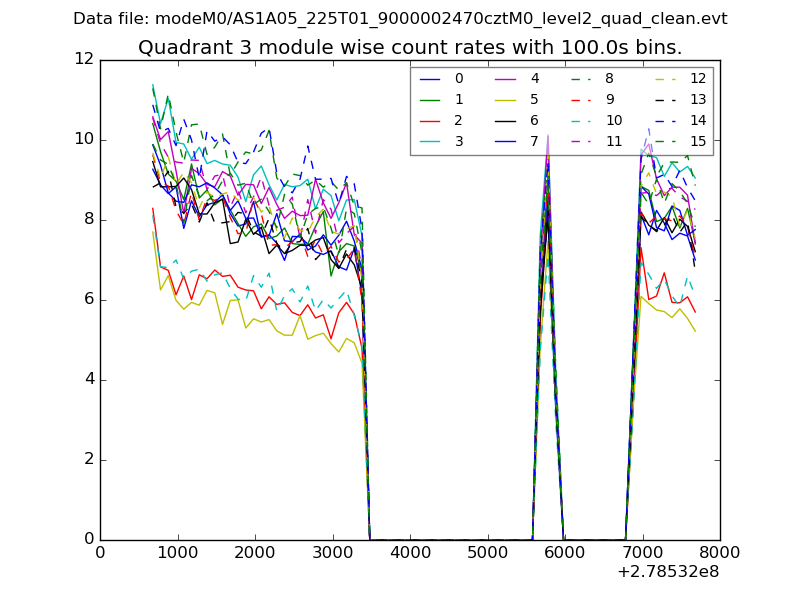
| Module-wise count rates for Quadrant C Data is divided into 100 sec bins |
 |
 |
| Module-wise count rates for Quadrant D Data is divided into 100 sec bins |
 |
 |
| Parameter | Plot |
|---|---|
| CZT HV Monitor |  |
| D_VDD | 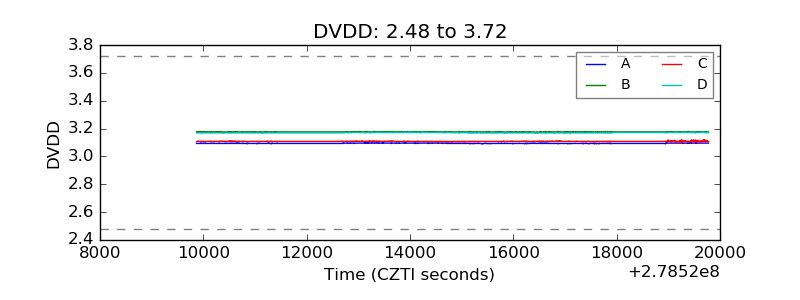 |
| Temperature 1 |  |
| Veto HV Monitor |  |
| Veto LLD |  |
| Alpha Counter |  |
| _CPM_Rate |  |
| CZT Counter |  |
| +2.5 Volts monitor | 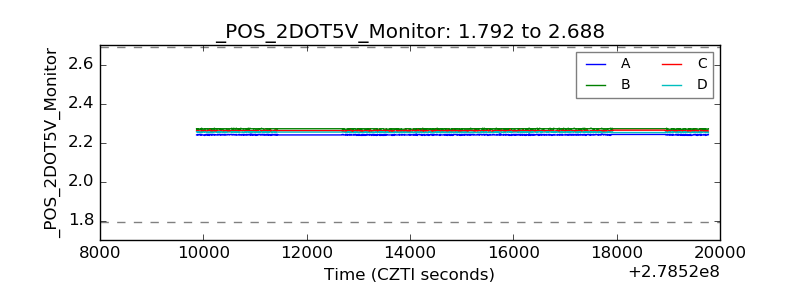 |
| +5 Volts monitor |  |
| _ROLL_ROT |  |
| _Roll_DEC |  |
| _Roll_RA |  |
| Veto Counter |  |