| Param | Original file | Final file |
|---|---|---|
| Filename | modeM0/AS1A05_012T02_9000002468cztM0_level2_bc.evt | modeM0/AS1A05_012T02_9000002468cztM0_level2_quad_clean.evt |
| Size (bytes) | 2,501,395,200 | 571,150,080 |
| Size | 2.3 GB | 544.7 MB |
| Events in quadrant A | 17,198,366 | 3,576,566 |
| Events in quadrant B | 11,110,939 | 3,721,832 |
| Events in quadrant C | 8,960,029 | 3,619,161 |
| Events in quadrant D | 35,493,869 | 3,360,776 |
| Mode M0 | |||
|---|---|---|---|
| Quadrant | BADHDUFLAG | Total packets | Discarded packets |
| A | 0 | 125326 | 0 |
| B | 0 | 97609 | 0 |
| C | 0 | 91518 | 0 |
| D | 0 | 188171 | 0 |
| Mode M9 | |||
|---|---|---|---|
| Quadrant | BADHDUFLAG | Total packets | Discarded packets |
| A | 0 | 83 | 0 |
| B | 0 | 83 | 0 |
| C | 0 | 83 | 0 |
| D | 0 | 83 | 0 |
| Mode SS | |||
|---|---|---|---|
| Quadrant | BADHDUFLAG | Total packets | Discarded packets |
| A | 0 | 892 | 0 |
| B | 0 | 892 | 0 |
| C | 0 | 892 | 0 |
| D | 0 | 892 | 0 |
| Quadrant | Total seconds | Saturated seconds | Saturation percentage |
|---|---|---|---|
| A | 43997 | 3733 | 8.484669% |
| B | 43997 | 569 | 1.293270% |
| C | 43997 | 544 | 1.236448% |
| D | 43997 | 7087 | 16.107916% |
Noise dominated data is calculated using 1-second bins in cleaned event files. If a bin has >2000 counts, and if more than 50% of those come from <1% of pixels, then it is considered to be noise-dominated and hence unusable.
| Quadrant | # 1 sec bins | Bins with >0 counts | Bins with >2000 counts | High rate bins dominated by noise | Noise dominated (total time) | Noise dominated (detector-on time) | Marked lightcurve |
|---|---|---|---|---|---|---|---|
| A | 52133 | 43994 | 320 | 320 | 0.61% | 0.73% |  |
| B | 52133 | 43999 | 1 | 1 | 0.00% | 0.00% |  |
| C | 52133 | 43998 | 0 | 0 | 0.00% | 0.00% |  |
| D | 52133 | 43995 | 631 | 631 | 1.21% | 1.43% |  |
Top three noisy pixels from each quadrant. If the there are fewer than three noisy pixels in the level2.evt file, extra rows are filled as -1
| Pixel properties | Quadrant properties | ||||||
|---|---|---|---|---|---|---|---|
| Quadrant | DetID | PixID | Counts | Sigma | Mean | Median | Sigma |
| A | 15 | 174 | 7584792 | 15318.74 | 2296 | 2262 | 495.0 |
| A | 12 | 96 | 432813 | 869.83 | 2296 | 2262 | 495.0 |
| A | 9 | 143 | 316269 | 634.38 | 2296 | 2262 | 495.0 |
| B | 0 | 229 | 738207 | 1657.76 | 2368 | 2314 | 443.9 |
| B | 15 | 35 | 705152 | 1583.3 | 2368 | 2314 | 443.9 |
| B | 0 | 189 | 236991 | 528.66 | 2368 | 2314 | 443.9 |
| C | 3 | 233 | 132331 | 245.9 | 2276 | 2260 | 529.0 |
| C | 7 | 247 | 59528 | 108.27 | 2276 | 2260 | 529.0 |
| C | 13 | 61 | 13494 | 21.24 | 2276 | 2260 | 529.0 |
| D | 1 | 52 | 15028237 | 29265.47 | 2196 | 2119 | 513.4 |
| D | 2 | 16 | 9471160 | 18442.29 | 2196 | 2119 | 513.4 |
| D | 5 | 222 | 880520 | 1710.81 | 2196 | 2119 | 513.4 |
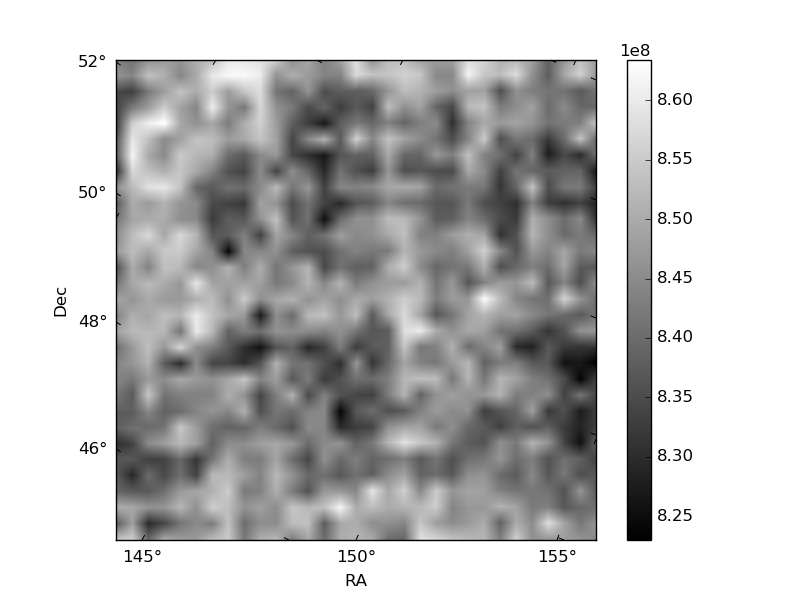
Histogram calculated using DETX and DETY for each event in the final _common_clean file
| Quadrant A |  |
 |
Quadrant B |
|---|---|---|---|
| Quadrant D |  |
 |
Quadrant C |
| Plot type | Count rate plots | Images |
|---|---|---|
| Comparison with Poisson distribution Blue bars denote a histogram of data divided into 1 sec bins. Red curve is a Poisson curve with rate = median count rate of data. |
 |
 |
| Quadrant-wise count rates Data is divided into 100 sec bins |
 |
|
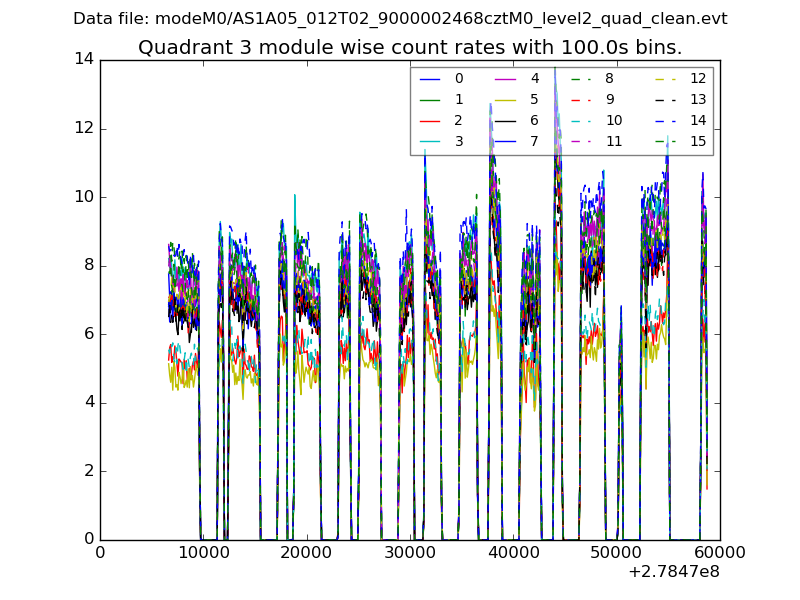
| Module-wise count rates for Quadrant A Data is divided into 100 sec bins |
 |
 |
| Module-wise count rates for Quadrant B Data is divided into 100 sec bins |
 |
 |
| Module-wise count rates for Quadrant C Data is divided into 100 sec bins |
 |
 |
| Module-wise count rates for Quadrant D Data is divided into 100 sec bins |
 |
 |
| Parameter | Plot |
|---|---|
| CZT HV Monitor |  |
| D_VDD |  |
| Temperature 1 | 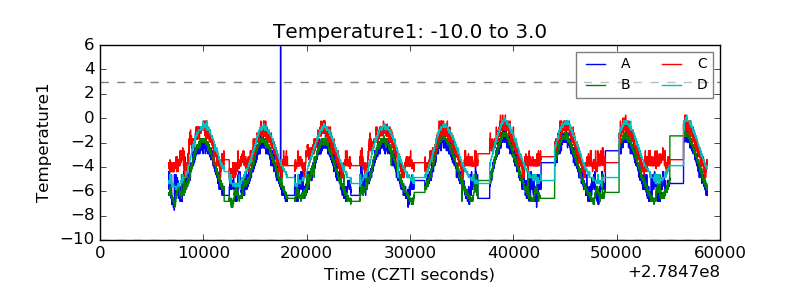 |
| Veto HV Monitor |  |
| Veto LLD | 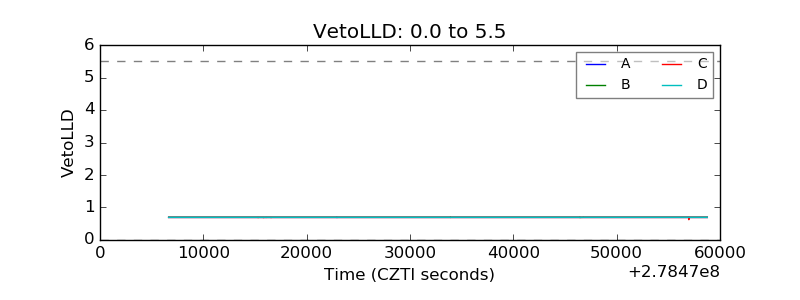 |
| Alpha Counter | 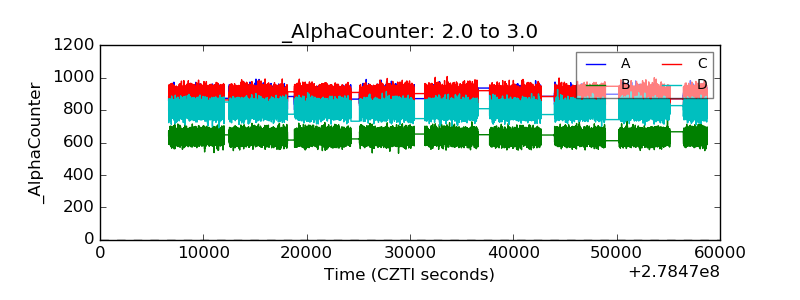 |
| _CPM_Rate |  |
| CZT Counter |  |
| +2.5 Volts monitor |  |
| +5 Volts monitor |  |
| _ROLL_ROT |  |
| _Roll_DEC |  |
| _Roll_RA |  |
| Veto Counter | 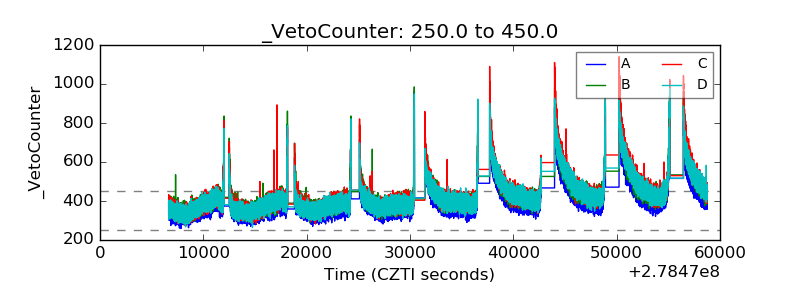 |