| Param | Original file | Final file |
|---|---|---|
| Filename | modeM0/AS1A05_101T09_9000002466cztM0_level2_bc.evt | modeM0/AS1A05_101T09_9000002466cztM0_level2_quad_clean.evt |
| Size (bytes) | 959,155,200 | 355,106,880 |
| Size | 914.7 MB | 338.7 MB |
| Events in quadrant A | 6,859,727 | 2,364,134 |
| Events in quadrant B | 4,712,971 | 2,459,252 |
| Events in quadrant C | 3,800,372 | 2,361,720 |
| Events in quadrant D | 12,338,094 | 2,222,397 |
| Mode M0 | |||
|---|---|---|---|
| Quadrant | BADHDUFLAG | Total packets | Discarded packets |
| A | 0 | 50811 | 0 |
| B | 0 | 42852 | 0 |
| C | 0 | 40019 | 0 |
| D | 0 | 69622 | 0 |
| Mode SS | |||
|---|---|---|---|
| Quadrant | BADHDUFLAG | Total packets | Discarded packets |
| A | 0 | 396 | 0 |
| B | 0 | 396 | 0 |
| C | 0 | 396 | 0 |
| D | 0 | 396 | 0 |
| Mode M9 | |||
|---|---|---|---|
| Quadrant | BADHDUFLAG | Total packets | Discarded packets |
| A | 0 | 15 | 0 |
| B | 0 | 15 | 0 |
| C | 0 | 15 | 0 |
| D | 0 | 15 | 0 |
| Quadrant | Total seconds | Saturated seconds | Saturation percentage |
|---|---|---|---|
| A | 19578 | 1195 | 6.103790% |
| B | 19578 | 308 | 1.573194% |
| C | 19578 | 220 | 1.123710% |
| D | 19578 | 1560 | 7.968127% |
Noise dominated data is calculated using 1-second bins in cleaned event files. If a bin has >2000 counts, and if more than 50% of those come from <1% of pixels, then it is considered to be noise-dominated and hence unusable.
| Quadrant | # 1 sec bins | Bins with >0 counts | Bins with >2000 counts | High rate bins dominated by noise | Noise dominated (total time) | Noise dominated (detector-on time) | Marked lightcurve |
|---|---|---|---|---|---|---|---|
| A | 20994 | 19578 | 230 | 230 | 1.10% | 1.17% |  |
| B | 20994 | 19579 | 3 | 3 | 0.01% | 0.02% | 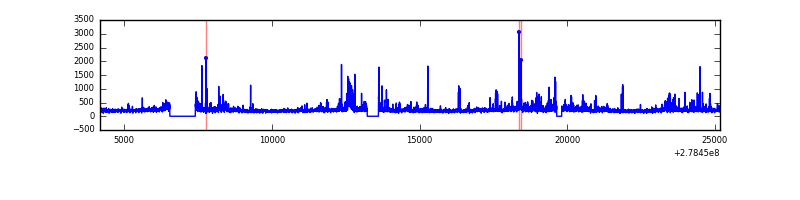 |
| C | 20994 | 19579 | 0 | 0 | 0.00% | 0.00% |  |
| D | 20994 | 19578 | 161 | 161 | 0.77% | 0.82% |  |
Top three noisy pixels from each quadrant. If the there are fewer than three noisy pixels in the level2.evt file, extra rows are filled as -1
| Pixel properties | Quadrant properties | ||||||
|---|---|---|---|---|---|---|---|
| Quadrant | DetID | PixID | Counts | Sigma | Mean | Median | Sigma |
| A | 15 | 174 | 2981748 | 14079.91 | 955 | 936 | 211.7 |
| A | 9 | 143 | 110412 | 517.11 | 955 | 936 | 211.7 |
| A | 12 | 96 | 61311 | 285.18 | 955 | 936 | 211.7 |
| B | 15 | 35 | 329842 | 1712.64 | 985 | 961 | 192.0 |
| B | 0 | 229 | 226148 | 1172.65 | 985 | 961 | 192.0 |
| B | 0 | 189 | 72329 | 371.65 | 985 | 961 | 192.0 |
| C | 3 | 233 | 107607 | 478.12 | 939 | 932 | 223.1 |
| C | 7 | 247 | 64908 | 286.74 | 939 | 932 | 223.1 |
| C | 8 | 128 | 11182 | 45.94 | 939 | 932 | 223.1 |
| D | 2 | 16 | 5461680 | 24856.69 | 932 | 898 | 219.7 |
| D | 1 | 52 | 2608527 | 11869.55 | 932 | 898 | 219.7 |
| D | 10 | 70 | 297311 | 1349.23 | 932 | 898 | 219.7 |
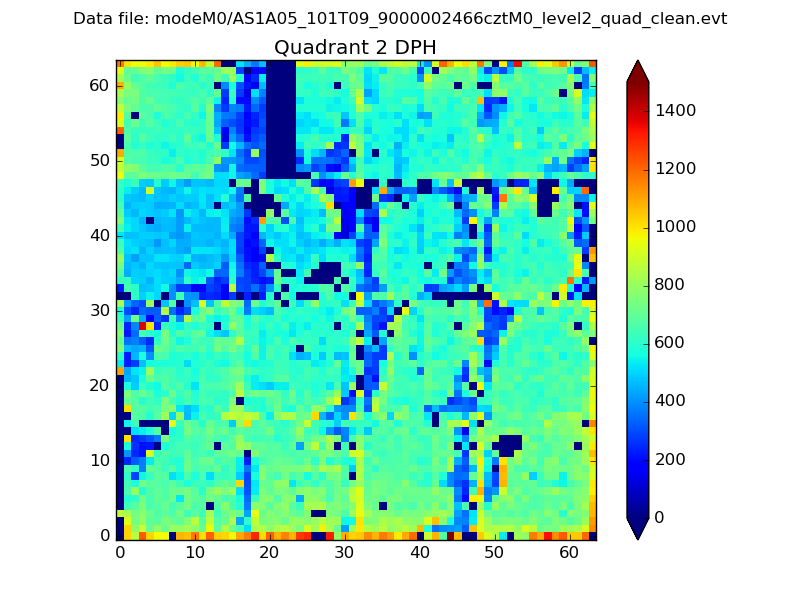
Histogram calculated using DETX and DETY for each event in the final _common_clean file
| Quadrant A |  |
 |
Quadrant B |
|---|---|---|---|
| Quadrant D |  |
 |
Quadrant C |
| Plot type | Count rate plots | Images |
|---|---|---|
| Comparison with Poisson distribution Blue bars denote a histogram of data divided into 1 sec bins. Red curve is a Poisson curve with rate = median count rate of data. |
 |
 |
| Quadrant-wise count rates Data is divided into 100 sec bins |
 |
|
| Module-wise count rates for Quadrant A Data is divided into 100 sec bins |
 |
 |
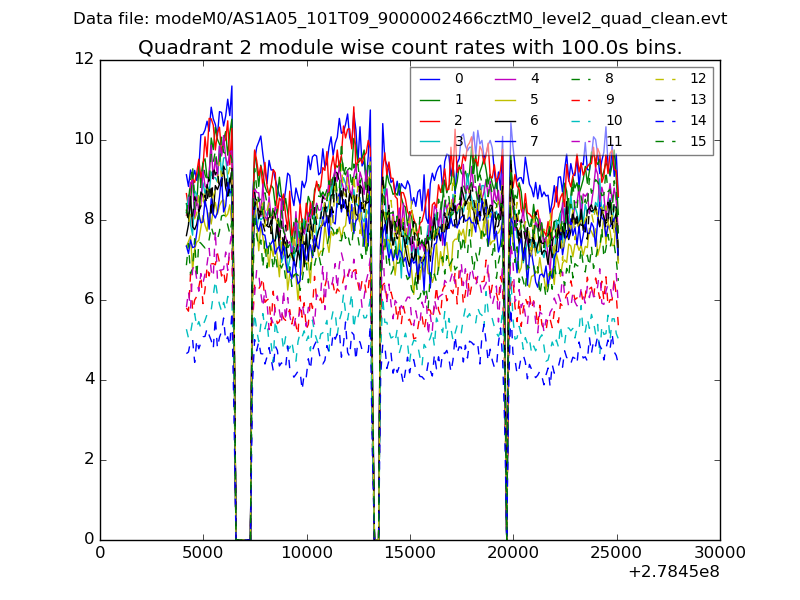
| Module-wise count rates for Quadrant B Data is divided into 100 sec bins |
 |
 |
| Module-wise count rates for Quadrant C Data is divided into 100 sec bins |
 |
 |
| Module-wise count rates for Quadrant D Data is divided into 100 sec bins |
 |
 |
| Parameter | Plot |
|---|---|
| CZT HV Monitor | 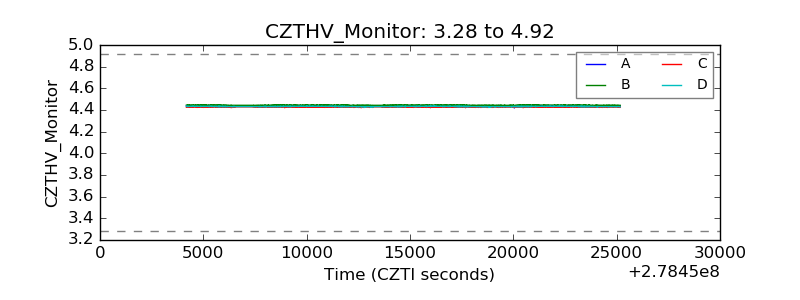 |
| D_VDD |  |
| Temperature 1 |  |
| Veto HV Monitor |  |
| Veto LLD |  |
| Alpha Counter | 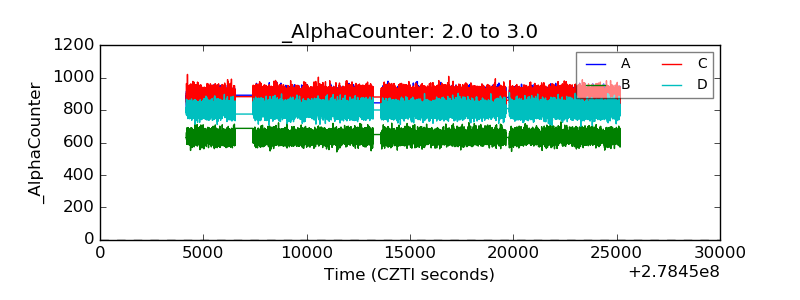 |
| _CPM_Rate | 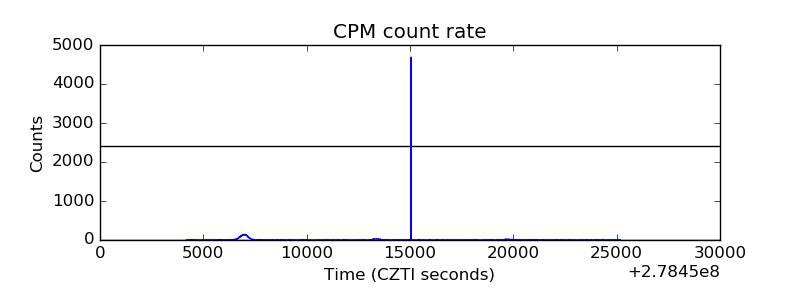 |
| CZT Counter |  |
| +2.5 Volts monitor |  |
| +5 Volts monitor | 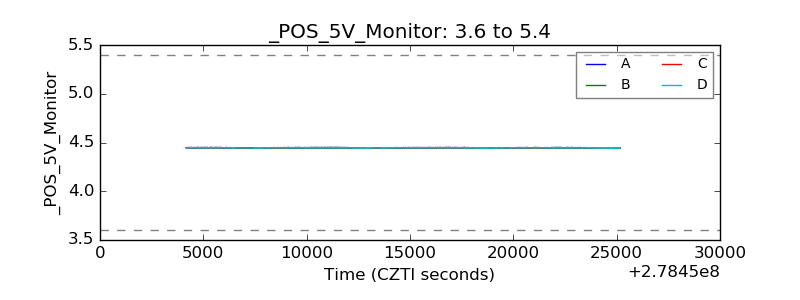 |
| _ROLL_ROT |  |
| _Roll_DEC |  |
| _Roll_RA |  |
| Veto Counter |  |